
- The price of gold is laterally quotes around $ 3,335 while investors expect the US PPI data for June.
- The price of goods imported by the US has increased due to tariffs imposed by President Trump.
- Operators reduce the Fed Dovish expectations before price pressures, accelerating due to Trump tariffs.
The price of gold (Xau/USD) quotes in a narrow range around $ 3,335 during European negotiation hours on Wednesday. The precious metal is consolidated while investors expect the data of the United States Production Price Index (US) for June, which will be published at 12:30 GMT.
Investors will closely follow the US PPI data for June, since they will indicate how much producers change the prices of goods and services at the doors of the factories to compensate for the impact of the tariffs imposed by President Donald Trump on steel and aluminum, and cars and their components.
Economists expect inflation at the producer level to have grown moderately in interannual terms. However, month by month, both the general and underlying PPI increased at a faster rate of 0.2%.
The US Consumer Price Index (ICC) showed on Tuesday that the prices of sectors with high imports increased dramatically, which led operators to reduce bets in favor of interest rate cuts by the Federal Reserve (FED) for the September policy meeting.
Principal Asset Management analysts said: “With increases in categories such as home furniture, recreation and clothing, import tariffs are leaked slowly, it would be prudent for the Fed to stay out for at least a few more months.”
Theoretically, the price of gold works better in an environment of high inflation. However, the maintenance of interest rates at higher levels by the Fed is negative for assets without yield, such as gold.
Meanwhile, commercial tensions between the European Union (EU) and the US continue to support the price of gold. A Bloomberg report showed on Tuesday that the commercial block is prepared to announce proportional countermeasures if commercial negotiations with the US do not materialize.
Technical Gold Analysis
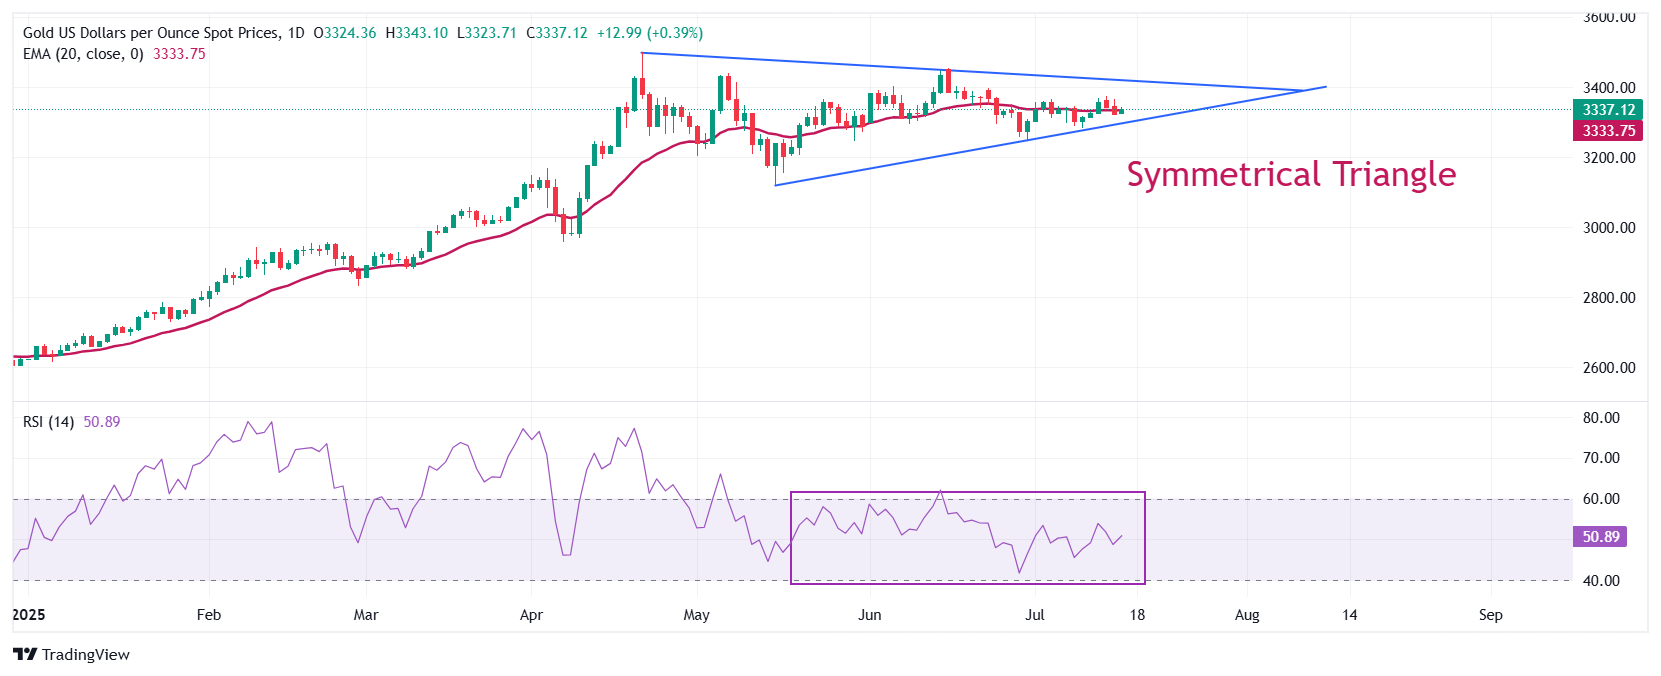
The price of gold is quoted in a symmetrical triangle formation in a daily temporal framework, indicating a contraction of volatility. The ascending trend line of the graphic pattern mentioned above is placed from the minimum of May 15, $ 3,120.83, while its descending edge is drawn from the maximum of April 22 around $ 3,500.
The precious metal quotes near the exponential mobile (EMA) average of 20 days around $ 3,333, indicating a lateral trend.
The 14-day relative force (RSI) index oscillates within the range of 40.00-60.00, suggesting indecision among market participants.
Looking up, the price of gold will enter an unexplored territory if it breaks decisively above the psychological level of $ 3,500. Potential resistances would be $ 3,550 and $ 3,600.
Alternatively, the price of gold would fall towards the round level support of $ 3,200 and the minimum of May 15 in $ 3,121, if it breaks below the minimum of May 29, $ 3,245.
Daily Gold Graph
GOLD – FREQUENT QUESTIONS
Gold has played a fundamental role in the history of mankind, since it has been widely used as a deposit of value and a half of exchange. At present, apart from its brightness and use for jewelry, precious metal is considered an active refuge, which means that it is considered a good investment in turbulent times. Gold is also considered a coverage against inflation and depreciation of currencies, since it does not depend on any specific issuer or government.
Central banks are the greatest gold holders. In their objective of supporting their currencies in turbulent times, central banks tend to diversify their reserves and buy gold to improve the perception of strength of the economy and currency. High gold reserves can be a source of trust for the solvency of a country. Central banks added 1,136 tons of gold worth 70,000 million to their reservations in 2022, according to data from the World Gold Council. It is the largest annual purchase since there are records. The central banks of emerging economies such as China, India and Türkiye are rapidly increasing their gold reserves.
Gold has a reverse correlation with the US dollar and US Treasury bonds, which are the main reserve and shelter assets. When the dollar depreciates, the price of gold tends to rise, which allows investors and central banks to diversify their assets in turbulent times. Gold is also inversely correlated with risk assets. A rebound in the stock market tends to weaken the price of gold, while mass sales in higher risk markets tend to favor precious metal.
The price of gold can move due to a wide range of factors. Geopolitical instability or fear of a deep recession can cause the price of gold to rise rapidly due to its condition of active refuge. As an asset without yield, the price of gold tends to rise when interest rates lower, while the money increases to the yellow metal. Even so, most movements depend on how the US dollar (USD) behaves, since the asset is quoted in dollars (Xau/USD). A strong dollar tends to keep the price of gold controlled, while a weakest dollar probably thrusts gold prices.
Source: Fx Street
I am Joshua Winder, a senior-level journalist and editor at World Stock Market. I specialize in covering news related to the stock market and economic trends. With more than 8 years of experience in this field, I have become an expert in financial reporting.


