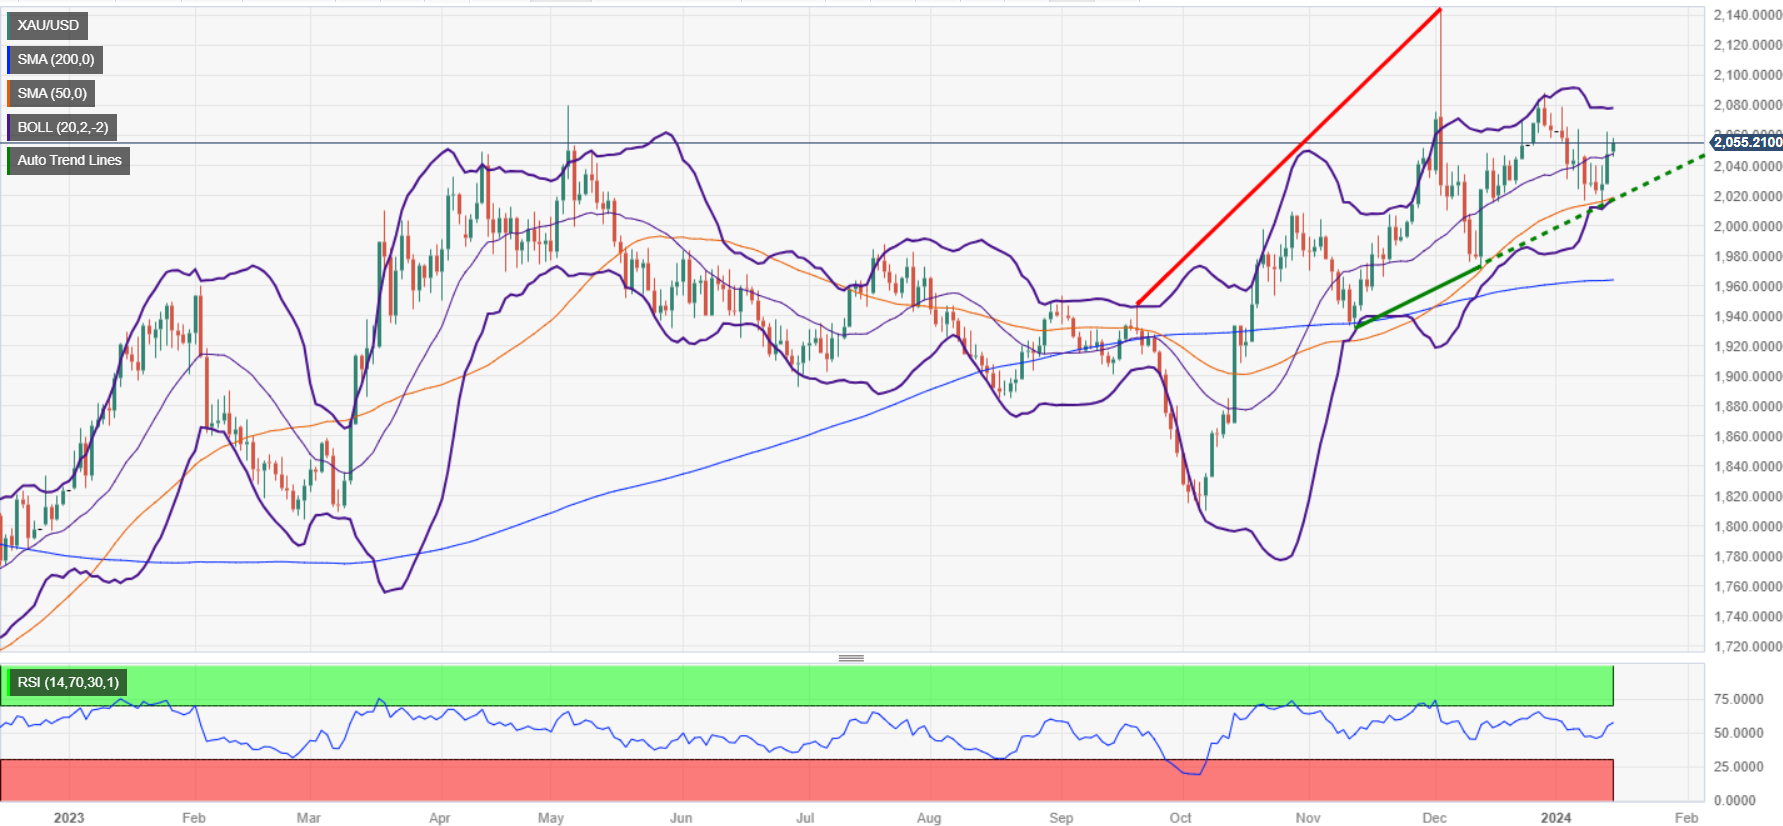
- Gold's continued rise is supported by risks in the Middle East involving Israel-Hamas and the Houthis versus the US-UK conflict.
- Market expectations of significant Fed rate cuts in 2024 boost Gold's appeal in the face of a weakening Dollar.
- Focus on upcoming US economic data and speeches by Fed officials for more information on Gold price dynamics.
Gold price extended its gains for three consecutive days and held firm above $2,050 on Monday amid light volume conditions sponsored by a holiday in the United States (US). Meanwhile, geopolitical risks remained the main driver, as XAU/USD is trading at $2.055, up 0.32%, after hitting a low of $2.046.
XAU/USD Rallyes on Sour Sentiment Weighing on Perceived Risk Assets
Tensions in the Middle East remain high, as the conflict between Israel and Hamas has extended to one hundred days, while the Houthi militia continued to launch missiles against ships and ships that would like to pass through the Red Sea. Consequently, the United States and the United Kingdom retaliated against the Iran-backed group, attacking the group's strategic objectives and spurring risk aversion in financial markets.
On top of that, increasing odds that the US Federal Reserve (Fed) cutting rates by 170 basis points in 2024 gave precious metals an upward move against the already battered DOLLAR. Additionally, US Treasury yields continued to decline, particularly the short end of the curve, as the 10-2 year yield curve is at -0.20 basis points, as the bond interest rate coupon The 2-year index is at 4.14%, while the 10-year reference index yields 3.941%.
Ahead of the week, the US economic calendar will feature Fed speakers led by Governor Christopher Waller, Michael Barr, Michelle Bowman and New York Fed President John Williams on Tuesday and Wednesday. As for data, the calendar will include retail sales, industrial production and consumer sentiment from the University of Michigan (UoM).
XAU/USD Price Analysis: Technical Outlook
The daily chart shows the yellow metal as biased neutral to the upside, but in the short term it has remained sideways. For a bullish continuation, buyers must overcome the December 28 high of $2,088.48 to challenge $2,100. A break of the latter will expose the all-time high at $2146.79. On the other hand, if the sellers drag the gold spot price below the 50-day moving average (at $2,019, that could pave the way for testing the $2,000 figure).

XAU/USD
| Overview | |
|---|---|
| Today last price | 2055.42 |
| Today I change daily | 7.82 |
| Today Daily change % | 0.38 |
| Today it opens every day | 2047.6 |
| Trends | |
|---|---|
| daily SMA20 | 2046.33 |
| daily SMA50 | 2017.22 |
| SMA100 daily | 1969.08 |
| SMA200 daily | 1963.56 |
| Levels | |
|---|---|
| Previous daily high | 2062.33 |
| Previous daily low | 2027.46 |
| Previous weekly high | 2062.33 |
| Previous weekly low | 2013.38 |
| Previous Monthly High | 2144.48 |
| Previous monthly low | 1973.13 |
| Daily Fibonacci 38.2% | 2049.01 |
| Daily Fibonacci 61.8% | 2040.78 |
| Daily Pivot Point S1 | 2029.26 |
| Daily Pivot Point S2 | 2010.93 |
| Daily Pivot Point S3 | 1994.39 |
| Daily Pivot Point R1 | 2064.13 |
| Daily Pivot Point R2 | 2080.67 |
| Daily Pivot Point R3 | 2099 |
Source: Fx Street
I am Joshua Winder, a senior-level journalist and editor at World Stock Market. I specialize in covering news related to the stock market and economic trends. With more than 8 years of experience in this field, I have become an expert in financial reporting.


