
- Gold price extends a five-day rally amid a broadly weakened US dollar.
- Risk aversion and falling Treasury yields fuel XAU/USD gains.
- A daily close above the 21-day SMA is key to further rallies.
The price of gold (XAU/USD) is returning to the highest levels in two weeks, while the bulls continue to receive support from the fall in US Treasury yields across the curve.
Risk aversion continues, accentuated by the weakness of the Eurozone and UK PMIs, which drives the demand for shelter in US public debt. This, in turn, weighs on Treasury yields, favoring the rise in non-yielding gold.
Besides, the yellow metal also benefits from a broadly weakened US dollar. The USD came under renewed selling pressure after the EUR/USD pair rallied sharply following the last aggressive comments of the president of the ECB, Christine Lagarde. The dollar keeps its corrective mode intact ahead of Wednesday’s release of the FOMC’s May meeting minutes.
The growing geopolitical tensions between the US and China over Taiwan they also bode well for the traditional safe haven of gold. US President Joe Biden remains committed to engaging militarily to defend the self-ruled island that China claims. Asked if there had been any change in policy after Monday’s remarks, Biden said “no.”
The focus now turns to the US manufacturing and services PMIs to be released later in the American session for further clues on risk sentiment and dollar dynamics.
gold daily chart
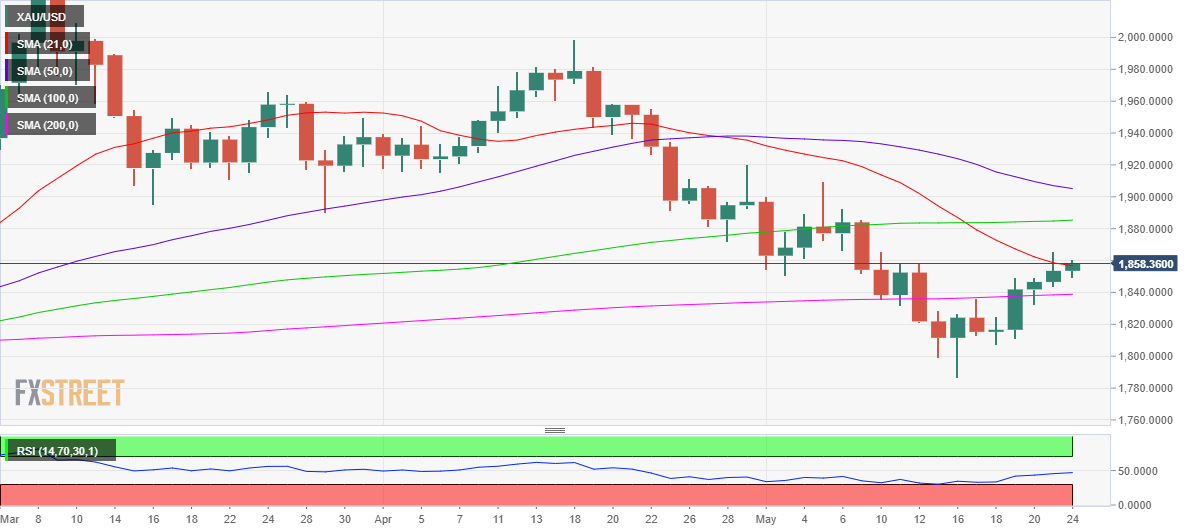
A daily close above the 21-day SMA is needed at $1,857 to confirm a bullish turn, exposing a further rally towards the slightly bullish 100 SMA on $1,885. Before that, the level of $1,870 Dollars could challenge bearish commitment.
On the other hand, immediate support is found at the psychological level of $1,850. Sellers will then target the horizontal 200 SMA at $1,839. Acceptance below this last level will trigger a further drop to $1,800.
Gold additional levels
Source: Fx Street
With 6 years of experience, I bring to the table captivating and informative writing in the world news category. My expertise covers a range of industries, including tourism, technology, forex and stocks. From brief social media posts to in-depth articles, I am dedicated to creating compelling content for various platforms.


