
- The gold price has turned around around $1,930 as investors are puzzled about the Fed’s future interest rate policy.
- Conflicting comments from Fed officials have kept investors on edge.
- Gold price is defending the horizontal support of the descending triangle chart pattern.
The price of Gold (XAU/USD) moves back and forth around $1,930 in the European session. The precious metal is showing non-directional performance as investors look puzzled as they assess hawkish testimony from Federal Reserve (Fed) Chairman Jerome Powell and dovish commentary from Atlanta Fed President Raphael Bostic.
S&P 500 futures post significant losses in Europe amid investor anxiety. Caution in the US market deepens as quarterly earnings season approaches. Tech stocks saw extreme pressure as investors expect tech giants to continue offering weak guidance due to the Fed’s interest rate hike.
The US Dollar Index (DXY) has pulled back after a less confident recovery move to near 101.95, as the impact of dovish comments from Bostic and Goolsbee has faded the impact of Jerome Powell’s hawkish testimony. Contrary to the USD index, Treasury yields have rebounded strongly. US 10-year Treasury yields have jumped to around 3.75%.
Raphael Bostic cited that the central bank should not raise interest rates any further or risk “unnecessarily” undermining the strength of the economy. While Chicago Fed President Austan Goolsbee was in favor of allowing current interest rates to take time to show their impact on the economy.
Gold technical analysis
Gold price consistently defends the horizontal support of the descending triangle chart pattern formed on a two-hour scale, which is from the May 30 low of $1,932.12. The downtrend line of the aforementioned chart pattern is drawn from the June 2 high of $1,983. The 200-period EMA at $1,953.62 acts as a roadblock for gold bulls. Horizontal resistance has been drawn since May 5 around $2,000.00.
The Relative Strength Index (RSI) (14) is oscillating in the bearish range of 20.00-40.00, indicating that the bearish momentum has been activated.
Gold two hour chart
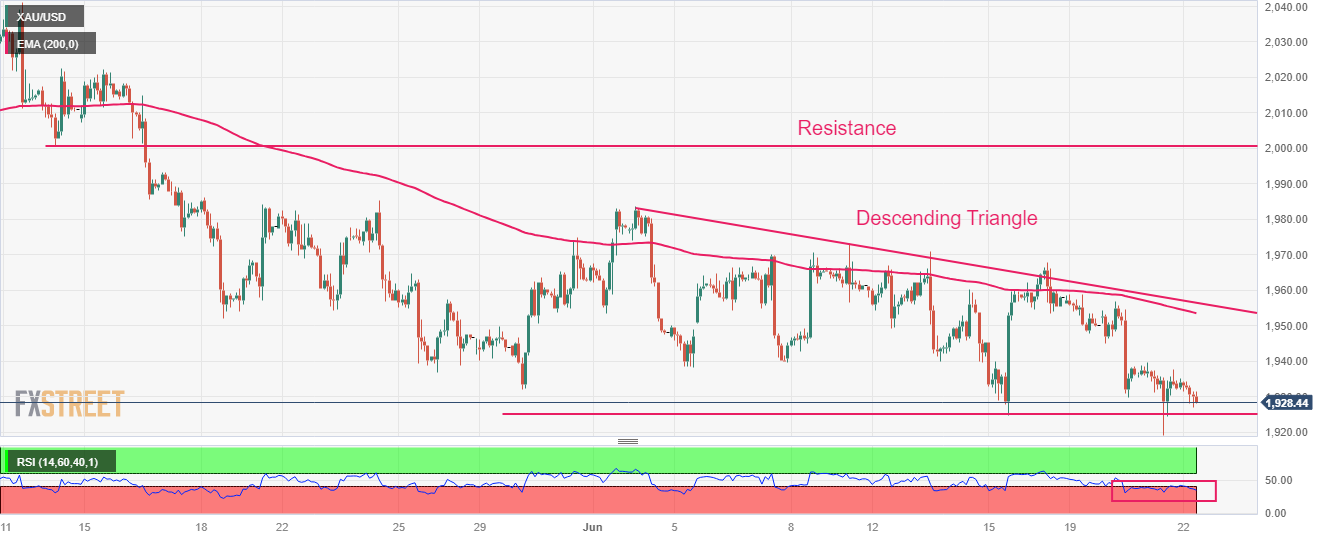
Source: Fx Street
I am Joshua Winder, a senior-level journalist and editor at World Stock Market. I specialize in covering news related to the stock market and economic trends. With more than 8 years of experience in this field, I have become an expert in financial reporting.


