
- The price of gold is up 0.24%, although it is facing solid resistance around $1,660.
- If XAU/USD breaks above $1,670, $1,700 can be tested.
- The formation of a bullish flag on the hourly chart of XAU/USD opens the door for further gains.
The price of gold advances steadily during the American session, although it remains limited below the 20-day EMA, despite the fall in US Treasury yields that underpins gold prices. yellow metal, as gold recovers after hitting a daily low of $1,638.40. At the time of writing this report, the XAU/USD It is trading at $1,653 a troy ounce, gaining 0.24%.
XAU/USD Price Forecast: Technical Outlook
From a daily chart point of view, XAU/USD has a bearish bias, as it has remained since breaking below the 200 EMA in mid-June 2022. It is worth noting that Tuesday’s daily high was within about to reach a downtrend line, drawn from the October highs, converging with the 20-day EMA. Therefore, XAU buyers need to break above $1,670, to exacerbate a rally towards the 100-day EMA at $1,690, ahead of $1,700. On the flip side, a daily close below Monday’s low of $1,644 would consolidate gold’s bearish bias, which it could not capitalize on, despite lower US bond yields, opening the door for further losses.
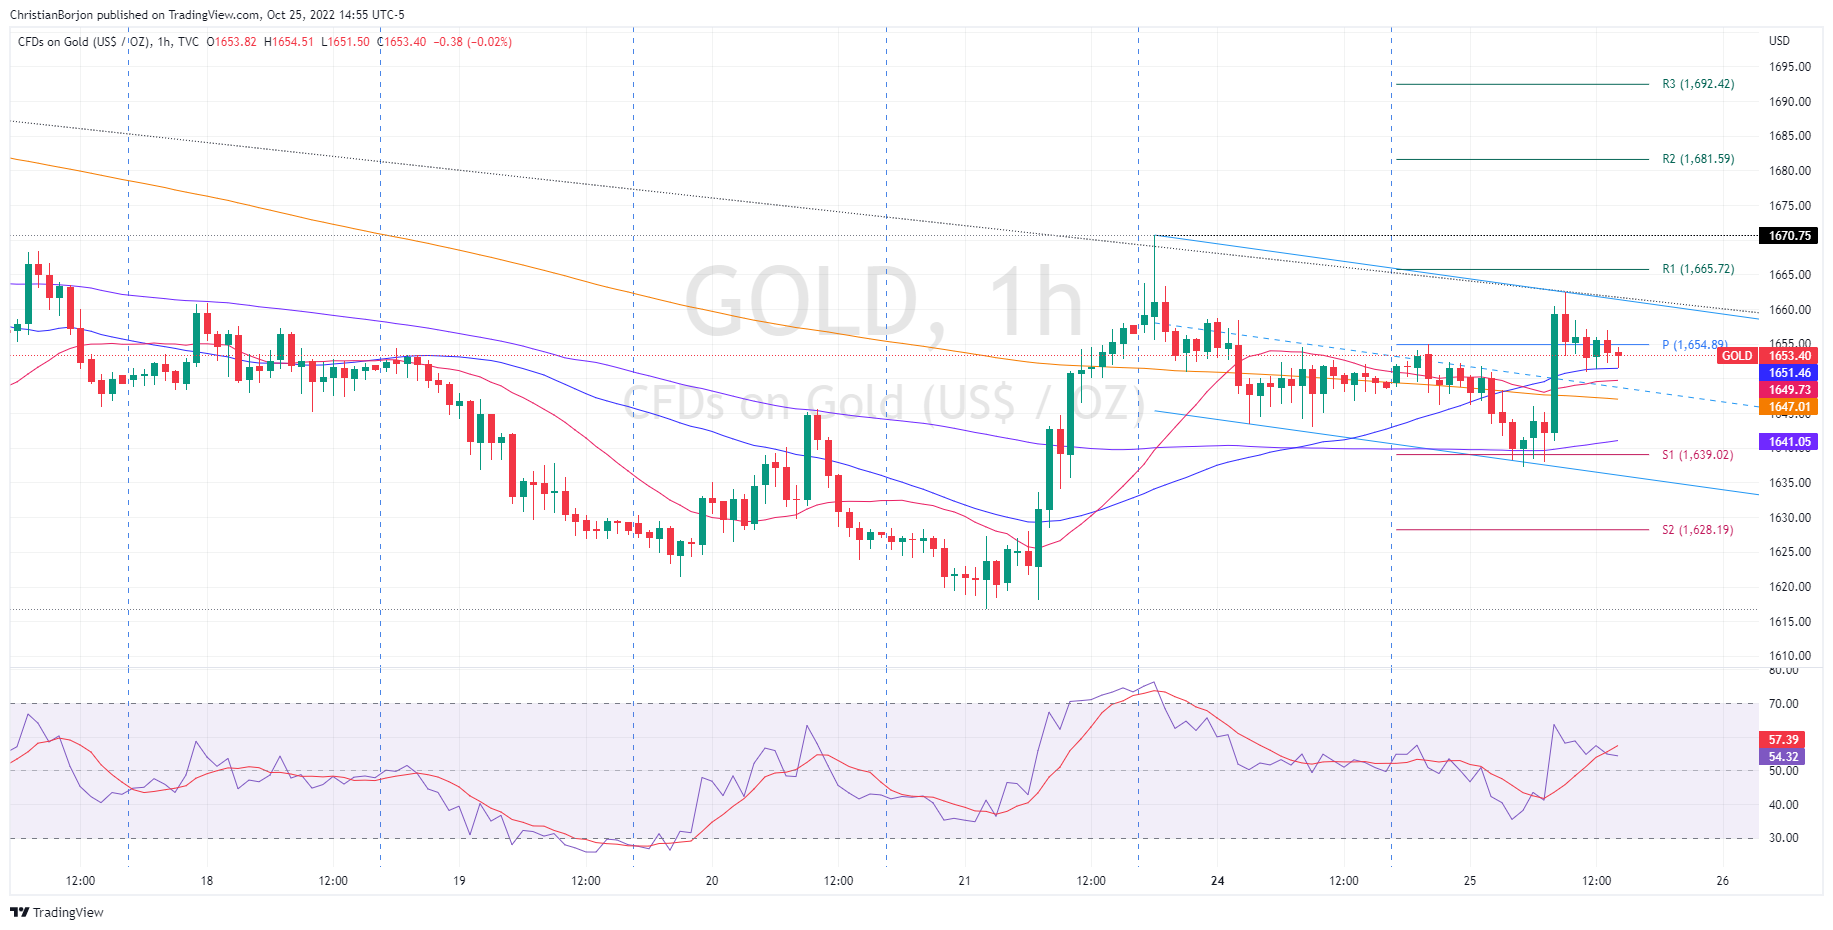
In the short term, the hourly chart of XAU/USD illustrates the formation of a bullish flag, opening the door for further gains. It is worth noting that gold has a neutral-upward bias, and once it breaks above it, the Oct 24 high of $1,670 will exacerbate a rally towards $1,700.
The first resistance for XAU/USD would be the daily pivot R1 at $1,665, before $1,670. Breaking above will expose the R2 pivot at $1,681, followed by the R3 daily pivot level at $1,692.42, ahead of $1,700.
On the other hand, if XAU/USD breaks below the confluence of several EMAs, led by the 20, 50 and 200 EMAs around $1,647-$1,651, it would send the price of the yellow metal towards the convergence of the EMA. of 100 and the daily pivot S1 around $1,639-41. Once broken, the next demand zone would be the lower uptrend line around $1,636.
XAU/USD Key Technical Levels
Source: Fx Street
With 6 years of experience, I bring to the table captivating and informative writing in the world news category. My expertise covers a range of industries, including tourism, technology, forex and stocks. From brief social media posts to in-depth articles, I am dedicated to creating compelling content for various platforms.


