
- Gold price is showing a back and forth movement above $1,960.00 as investors are undecided on Fed policy.
- Investors are concerned that the US CPI could prove more persistent.
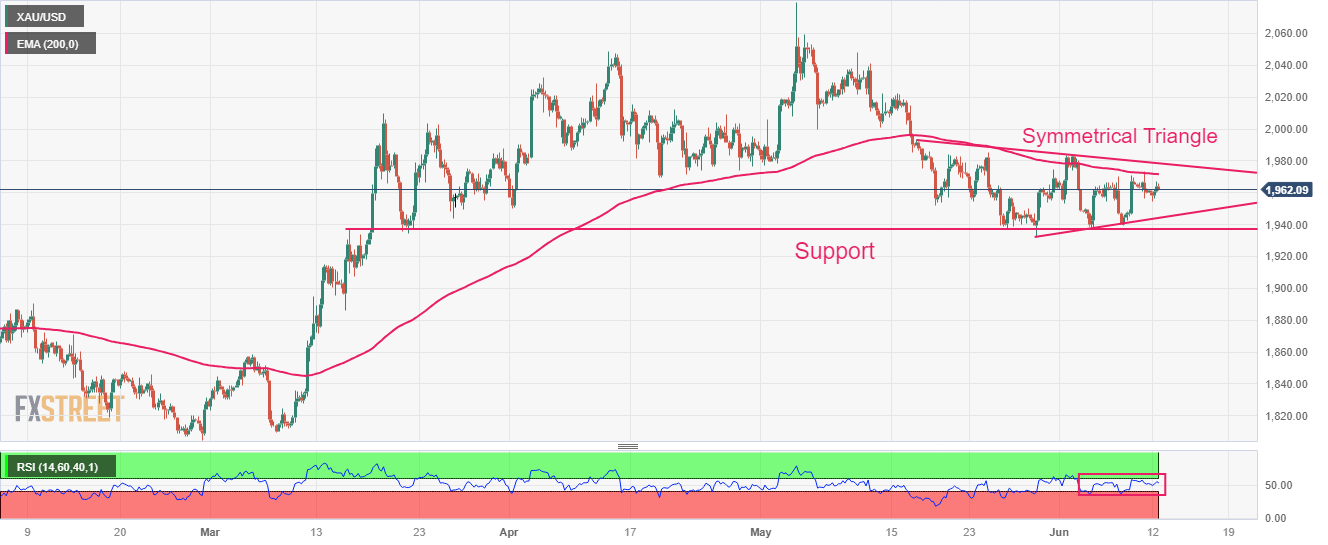
- The gold price is bidding in a symmetrical triangle, indicating a contraction in volatility.
The price of gold (USD/XAU) is showing reversal movements around $1,963.00 at the beginning of the American session. The precious metal has become choppy as general sentiment is showing mixed responses towards the Federal Reserve’s (Fed) interest rate decision.
In a place where US labor market conditions are releasing heat, investors remain concerned that the US Consumer Price Index (CPI) could prove more persistent.
US stocks are expected to open positively as S&P 500 futures have posted big gains in the European session. Market sentiment is quite bullish as the US economy is expected to show resilience going forward.
The latest data from the Fed shows that lending and deposit activities have increased consecutively for three weeks at commercial banks in the week ending May 31. Business demand for credit appears robust despite Fed Chairman Jerome Powell’s aggressive tightening of monetary policy.
The Dollar Index (DXY) is struggling to extend its rally above 103.50 as investors prepare for the US open after the weekend.
Gold Technical Analysis
The gold price is bidding in a Symmetrical Triangle on a four-hour scale, indicating a contraction in volatility. The uptrend line of the aforementioned chart pattern is drawn from the May 30 low at $1,932.12, while the downtrend line starts from the May 17 high at $1,993.13. Horizontal support lies from the March 15 high at $1,943.58.
The 200-period EMA at $1,971.77 acts as a roadblock for gold bulls.
Meanwhile, the Relative Strength Index (RSI) (14) oscillates in the 40.00-60.00 range, showing non-directional behavior.
Looking ahead, if it breaks above the June 1 high at $1,982.72, Gold bulls will continue to rally towards the May 5 low around $2,000.00, followed by the April 17 high at around $2,017.00.
Conversely, a break below the June 7 low at $1,939.72 will drag Gold bulls towards the May 18 low at $1,918.31 and round level support at $1,900.00.
4 hour chart gold
Source: Fx Street
I am Joshua Winder, a senior-level journalist and editor at World Stock Market. I specialize in covering news related to the stock market and economic trends. With more than 8 years of experience in this field, I have become an expert in financial reporting.


