
- The price of gold falls due to the improvement in risk appetite and the increase in the yield of US Treasury bonds.
- US Treasury yields rise, with 10-year yields a proxy for real yields advancing above 1.30%.
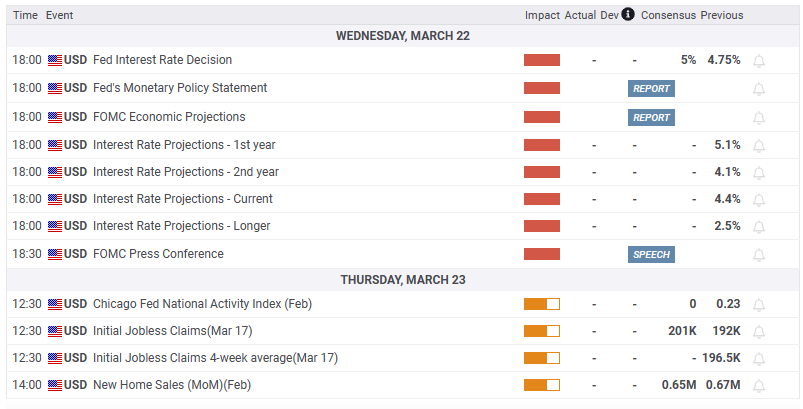
- The Federal Reserve will kick off its two-day monetary policy meeting, at which a 25 basis point rate hike is expected.
Gold price is falling across the board by more than $30.00 or 1.59% as US Treasury yields rise while improving risk appetite dented demand for Gold Hence, US stocks rise moderately ahead of the imminent start of the Federal Reserve Open Market Committee (FOMC) meeting. At the time of writing, the XAU/USD pair is trading at $1,947.26, after reaching a daily high of $1,985.08.
Gold Price Falls on High Real Yields in the US, with Traders Booking Profits
Trader fears eased in the last 48 hours following the UBS Acquisition of Credit Suisse, and US banks continued to try to stabilize First Republic Bank. The Federal Reserve (Fed) is set to begin its March policy meeting, and traders expect the Fed to hike rates by 25 basis points as Powell and company continue their efforts to curb stubbornly high inflation.
XAU/USD retraced most of its gains after hitting a yearly high of $2,009.75 on Monday. Since then, the yellow metal has tumbled 3.09% as traders apparently took profit ahead of the FOMC meeting.
According to CME’s FedWatch tool, money market futures anticipate an 83.4% chance that the federal funds rate (FFR) will rise by a quarter of a percentage point. However, there is still uncertainty surrounding the possible outcome of Fed Chairman Jerome Powell’s press conference, which could cause instability in financial markets.
Another reason for XAU/USD falling is that US Treasury yields are rising. The yield on the 10-year US Treasury bond is 3.58%, up nine basis points. The 10-year Stock Inflation Protected Securities (TIPS), a proxy for US real yields, stands at 1,351% after falling to 1,142% on March 16.
Meanwhile, the Dollar Index, a gauge of the dollar’s value against six currencies, is paring some of its previous losses after hitting a low of 103.00, shedding 0.03%, at 103.274.
Gold Technical Analysis
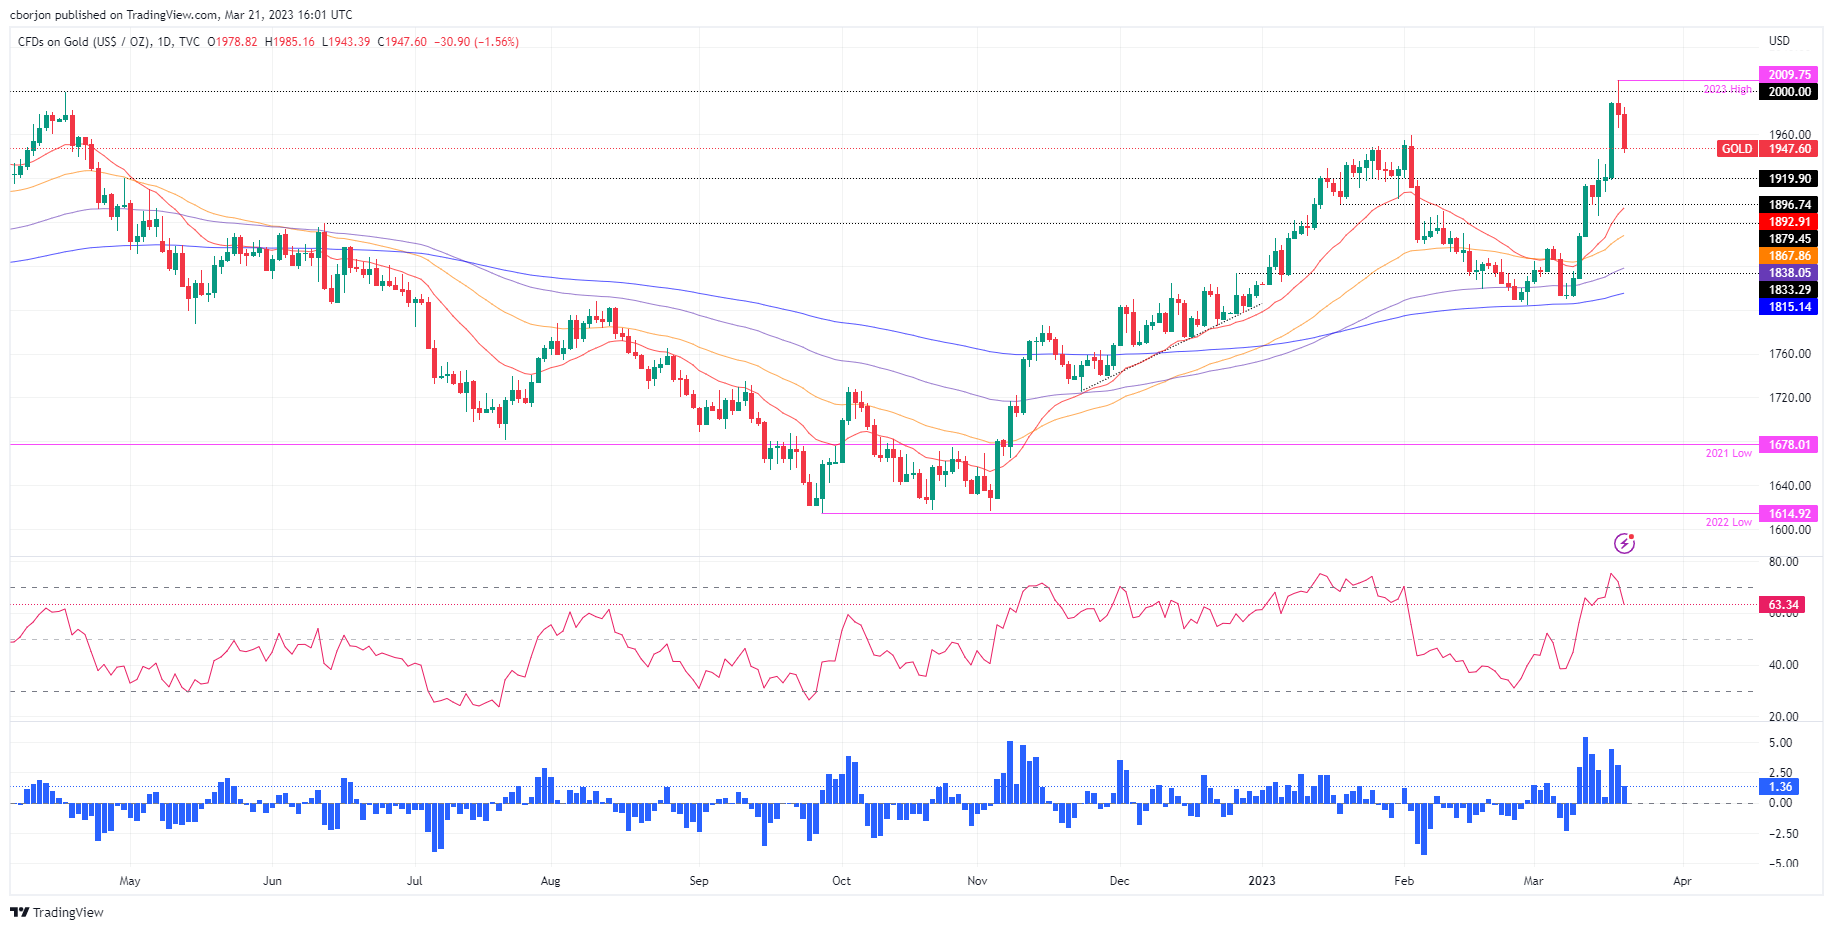
The daily chart of the XAU/USD shows a bullish trend in the yellow metal. However, the price action in the last three days could form an evening star candlestick chart pattern. This means that Gold may fall in the short term. The first support would be the daily high of March 15 turned into support at $1937.31, followed by the $1900 barrier. Once broken, the 20 day EMA at $1892.89 is next, followed by the 50 day EMA at $1867.89.
What is there to watch out for?
Source: Fx Street
I am Joshua Winder, a senior-level journalist and editor at World Stock Market. I specialize in covering news related to the stock market and economic trends. With more than 8 years of experience in this field, I have become an expert in financial reporting.


