
- The price of Gold plummets more than 1%, marking a new cycle low below $1,884.89.
- Rising US bond yields and the looming threat of a US government shutdown added to the already deteriorating mood, sending Gold prices tumbling.
- Minnesota Fed President Neil Kashkari remains hawkish and opens the door to more than one hike.
Gold price plunged more than 1% midway through the New York session, setting a new cycle low below the Aug. 21 swing low of $1,884.89, as sellers set their sights on higher levels. March 2023 lows, around $1,800. At the time of writing, the XAU/USD pair is trading at $1,875 after reaching a daily high of $1,903.98.
XAU/USD under immense pressure as US Treasury yields soar
Risk aversion and rising US bond yields keep XAU/USD under pressure. US Treasury yields continued to rise, with the 10-year yields last seen at 4.63%, gaining 1.90%, while fears of the US Federal Government shutdown, that could furlough millions of federal employees next Saturday, added another reason to the already sour sentiment.
Meanwhile, Minnesota Fed President Neil Kashkari continued his parade on Wednesday, noting that he’s not sure the Federal Reserve is tight enough and suggesting another rate hike is necessary. He added that he expects the US central bank to keep rates “stable” while leaving the door open to more than one hike, Kashkari said recently in an interview with Fox Business.
Previously, the US economic agenda revealed that US durable goods orders for August rose more than expected, by 0.2% mom, with estimates for a -0.2% drop; Excluding transportation, the so-called underlying, reached 0.4% month-on-month, above estimates and 0.1% expansion the previous month.
XAU/USD traders will follow US economic releases. The final revision of second-quarter gross domestic product (GDP), pending home sales, initial jobless claims and Fed data will be released on Thursday. The Fed’s preferred inflation gauge will be announced on Friday , the underlying PCE.
XAU/USD Price Analysis: Technical Outlook
Gold’s daily chart shows the unperforming metal extending its losses towards the March 8 low of $1,809.48. If that level is broken, the yellow metal could test the lows around $1,804.78. Once this level is surpassed, the next support for XAU/USD would be the daily high of November 15, 2022, at $1,786.53. On the contrary, if XAU/USD recovers $1,884.89, the first resistance would be $1,900.
XAU/USD Price Action – Daily Chart
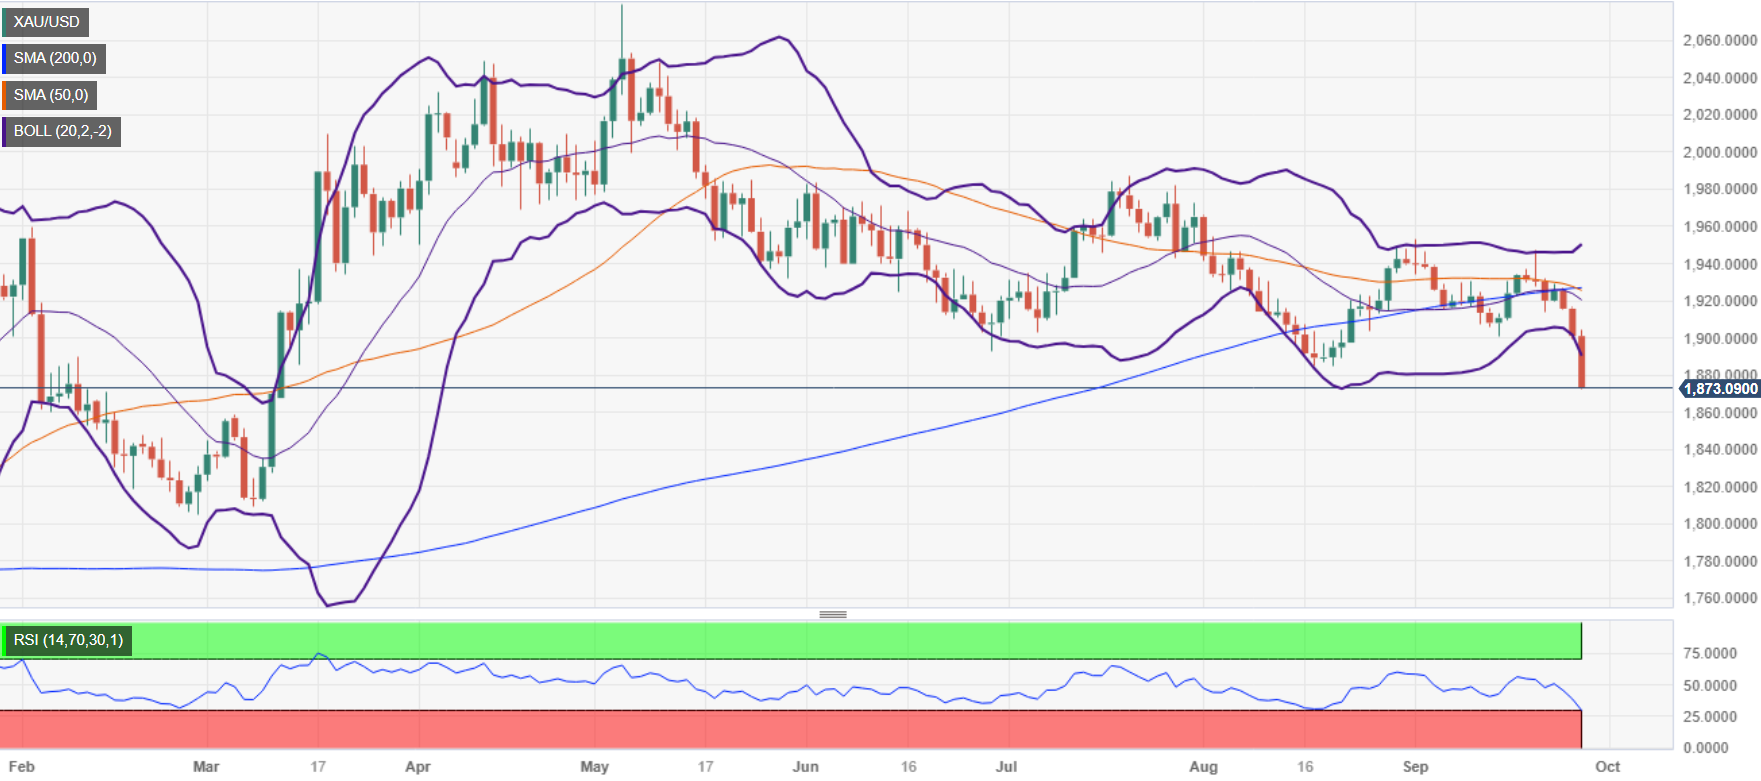
Source: Fx Street
I am Joshua Winder, a senior-level journalist and editor at World Stock Market. I specialize in covering news related to the stock market and economic trends. With more than 8 years of experience in this field, I have become an expert in financial reporting.


