
- Positive US Durable Goods Orders and Consumer Confidence data curbs Gold’s appeal.
- A rebound in new home sales and rising Treasury yields add to Gold’s woes.
- Market participants are closely watching the upcoming remarks from Fed Chairman Powell.
Gold price pulls back after reaching a daily high of $1,930.66 on upbeat data from the United States, which portrays the resilience of the economy, despite rising borrowing costs set by the US Federal Reserve .UU. (Fed). US Treasury yields are a headwind for the yellow metal. He XAU/USD It is trading at $1,919, with a loss of 0.18%.
XAU/USD under pressure as US Treasury and Fed yields rally
XAU/USD remains under pressure as market sentiment turns positive. US durable goods orders surprised market participants by rising 1.7%m/m in May, above estimates for a -1% drop, and 0.5% above the 1.2% figure for April. The data eases fears of a hard landing in the US, as witnessed by falling gold prices, which are often sought as a haven asset in times of global economic slowdown.
In additional data, excluding transportation, orders rose 0.6%, above estimates for a -0.1% contraction, and exceeding April’s -0.6% decline.
The Conference Board (CB) recently revealed that Consumer Confidence improved in June to 109.7, beating estimates of 104 and up from 10.5 in May. Comments from Dana Peterson, the Conference Board’s Chief Economist, showed that the mood among Americans is positive about job hunting, although earnings expectations are down slightly; at the same time, consumers see a decline in inflation ahead.
In other data, US new home sales advanced in May at their fastest pace in more than a year, boosting the US dollar (USD), which continued to strengthen against precious metal prices. New home sales rose 12.2% month-on-month, up from 3.5% in April, and came in at a seasonally adjusted annualized rate of 763,000 homes, the US Commerce Department showed.
Meanwhile, the US Dollar Index (DXY), which tracks the value of the Dollar against a basket of pairs, is down 0.20% to 102.552; but US Treasury yields are advancing. The 10-year US Treasury yields 3.772%, up 4.2 basis points, and supports US real yields from Monday’s close at 1.54% to 1.592%, a headwind for the XAU/USD.
Given the background, and with US Federal Reserve (Fed) Chairman Jerome Powell speaking at the European Central Bank (ECB) event in Sintra, I would probably keep XAU/USD prices range bound. tight as traders dissect Powell’s comments. Lately, the Fed chair has remained between neutral and hawkish, though he has repeated that there are two more rate hikes on the table, despite the fact that CME’s FedWatch tool shows that market participants don’t think the Fed will go to raise rates beyond the 5.25%-5.50% range.
XAU/USD Price Analysis: Technical Perspective
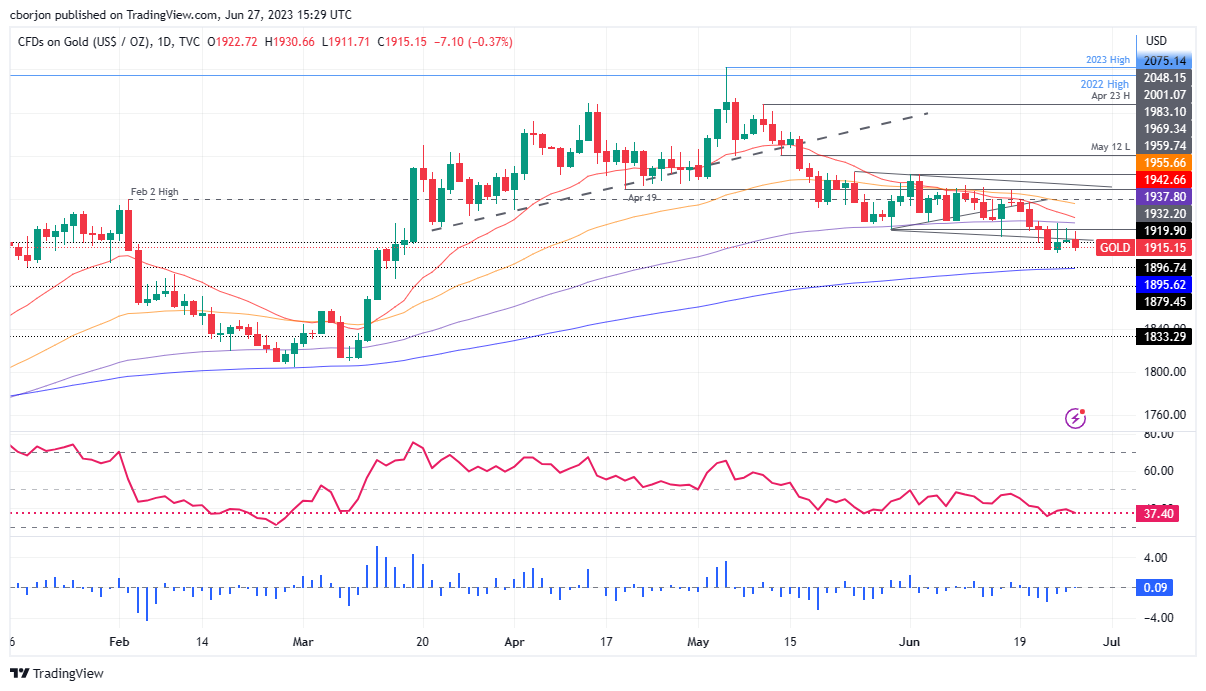
The XAU/USD pair maintains a neutral bias to the downside after a bearish crossover occurred on June 7, with the 20-day EMA dipping below the 50-day EMA. At the time of writing, the 20-day EMA is closing the gap relative to the 100-day EMA, which sits at $1,937.88 and acts as strong dynamic support, with XAU buyers unable to break through. . If the XAU/USD extends its losses beyond $1,900, the next support level will be the 200-day EMA at $1,895.65. If this last level is broken, XAU/USD could slide towards the next swing low, the daily low of March 8 at $1,809.48.
Source: Fx Street
I am Joshua Winder, a senior-level journalist and editor at World Stock Market. I specialize in covering news related to the stock market and economic trends. With more than 8 years of experience in this field, I have become an expert in financial reporting.


