
- The price of gold is consolidated around $ 3,340 before the US employment data for June.
- The surprisingly optimistic data of US Jolts employment offers have supported the US dollar.
- The feeling of the market remains cautious as the deadline of Trump tariffs on July 9 is approaching.
The price of gold (Xau/USD) quotes in a narrow range around $ 3,340 during the European negotiation session on Wednesday. The yellow metal fights to find direction while investors expect the data of non -agricultural payroll (NFP) of the United States (USA) for June, which will be published on Thursday.
Investors will pay special attention to US NFP data since some Federal Reserve officials (FED) have argued in favor of early cuts in interest rates, citing risks in the labor market. “The Fed should not wait for the collapse labor market to cut rates,” said Fed governor Christopher Waller, in an interview near the last week of June.
Theoretically, lower interest rates by the Fed are favorable for assets that do not generate performance, such as gold.
Before the US NFP data, investors expect ADP employment change data for June, which will be published at 12:15 GMT. The US private sector is expected to have added 95,000 new workers, significantly more than the 37,000 registered in May.
Meanwhile, a decent recovery movement in the US dollar (USD), after the optimistic data of US Jolts jobs for May, has also limited the bullish potential of the price of gold. A stronger US dollar makes gold a expensive bet for investors.
The American dollar index (DXY), which tracks the value of the dollar against six main currencies, is abruptly recovered to about 97.00 after breaking a nine -day streak of losses.
In the Economic Front, the uncertainty around the deadline of reciprocal tariffs on July 9 and the progress in the so -called “Great Project” of the US President Donald Trump, will continue to support the price of gold.
Technical Gold Analysis
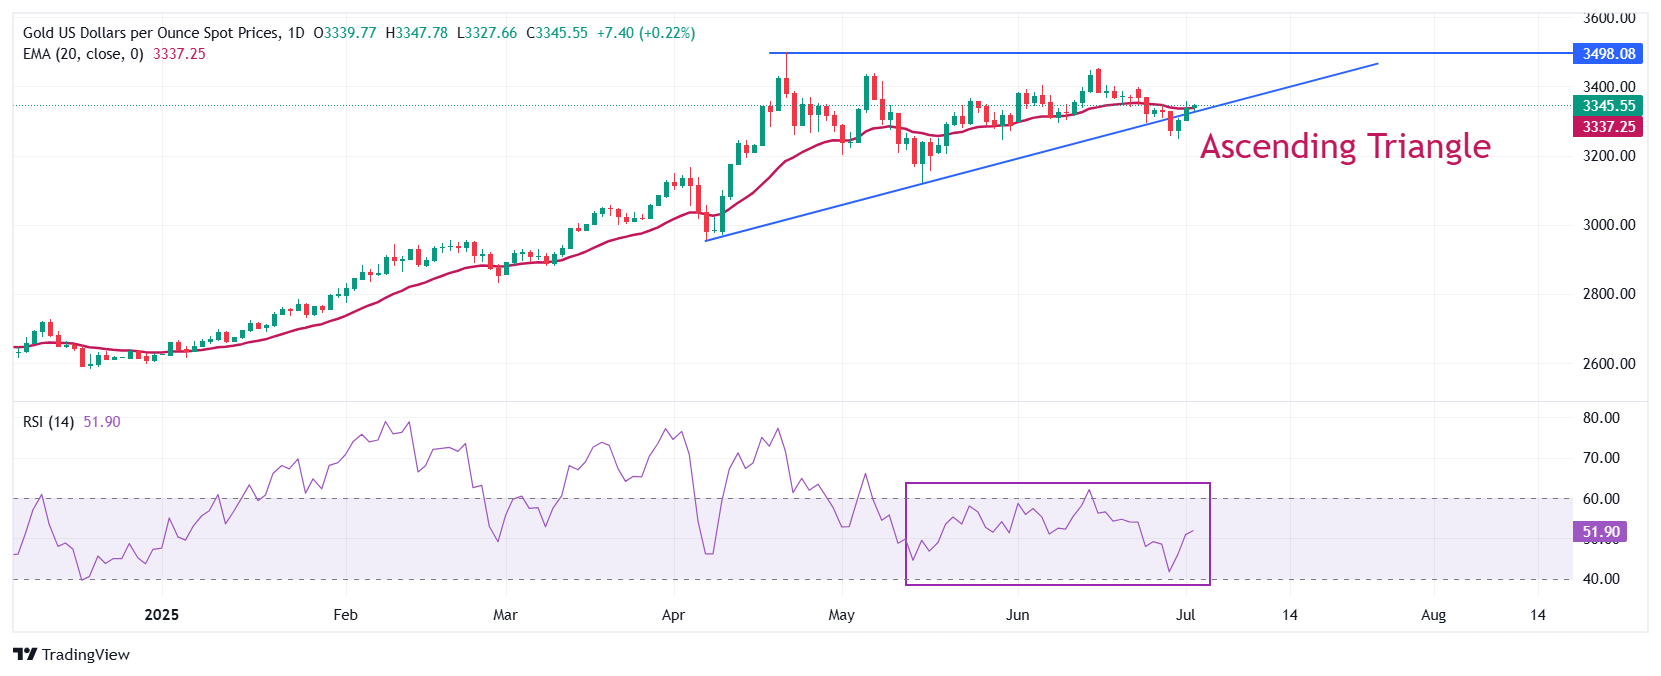
The price of gold is listed near the ascending trend line of an ascending triangle formation in a daily frame, which is drawn from the minimum of April 7, 2,957 $. The horizontal resistance of the graphic pattern mentioned above is drawn from the maximum of April 22 around $ 3,500. Theoretically, a breakdown of the asset below the ascending trend line would result in an abrupt fall.
The precious metal oscillates near the exponential (EMA) mobile average of 20 days around $ 3,342, suggesting that the short -term trend is uncertain.
The 14-day relative force (RSI) index oscillates within the range of 40.00-60.00, indicating a lateral trend.
Looking up, the price of gold would enter an unexplored territory after breaking decisively above the psychological level of $ 3,500. Potential resistances would be $ 3,550 and $ 3,600.
Alternatively, a downward movement of the gold price below the minimum of May 29, $ 3,245 would drag it towards the round level support of $ 3,200, followed by the minimum of May 15 at $ 3,121.
Daily Gold Graph
GOLD – FREQUENT QUESTIONS
Gold has played a fundamental role in the history of mankind, since it has been widely used as a deposit of value and a half of exchange. At present, apart from its brightness and use for jewelry, precious metal is considered an active refuge, which means that it is considered a good investment in turbulent times. Gold is also considered a coverage against inflation and depreciation of currencies, since it does not depend on any specific issuer or government.
Central banks are the greatest gold holders. In their objective of supporting their currencies in turbulent times, central banks tend to diversify their reserves and buy gold to improve the perception of strength of the economy and currency. High gold reserves can be a source of trust for the solvency of a country. Central banks added 1,136 tons of gold worth 70,000 million to their reservations in 2022, according to data from the World Gold Council. It is the largest annual purchase since there are records. The central banks of emerging economies such as China, India and Türkiye are rapidly increasing their gold reserves.
Gold has a reverse correlation with the US dollar and US Treasury bonds, which are the main reserve and shelter assets. When the dollar depreciates, the price of gold tends to rise, which allows investors and central banks to diversify their assets in turbulent times. Gold is also inversely correlated with risk assets. A rebound in the stock market tends to weaken the price of gold, while mass sales in higher risk markets tend to favor precious metal.
The price of gold can move due to a wide range of factors. Geopolitical instability or fear of a deep recession can cause the price of gold to rise rapidly due to its condition of active refuge. As an asset without yield, the price of gold tends to rise when interest rates lower, while the money increases to the yellow metal. Even so, most movements depend on how the US dollar (USD) behaves, since the asset is quoted in dollars (Xau/USD). A strong dollar tends to keep the price of gold controlled, while a weakest dollar probably thrusts gold prices.
Source: Fx Street
I am Joshua Winder, a senior-level journalist and editor at World Stock Market. I specialize in covering news related to the stock market and economic trends. With more than 8 years of experience in this field, I have become an expert in financial reporting.


