
- The price of Gold has extended its recovery to near $1,950, while the DXY Dollar Index has fallen sharply.
- Investors have begun to ignore fears associated with expectations of further interest rate hikes from the Fed.
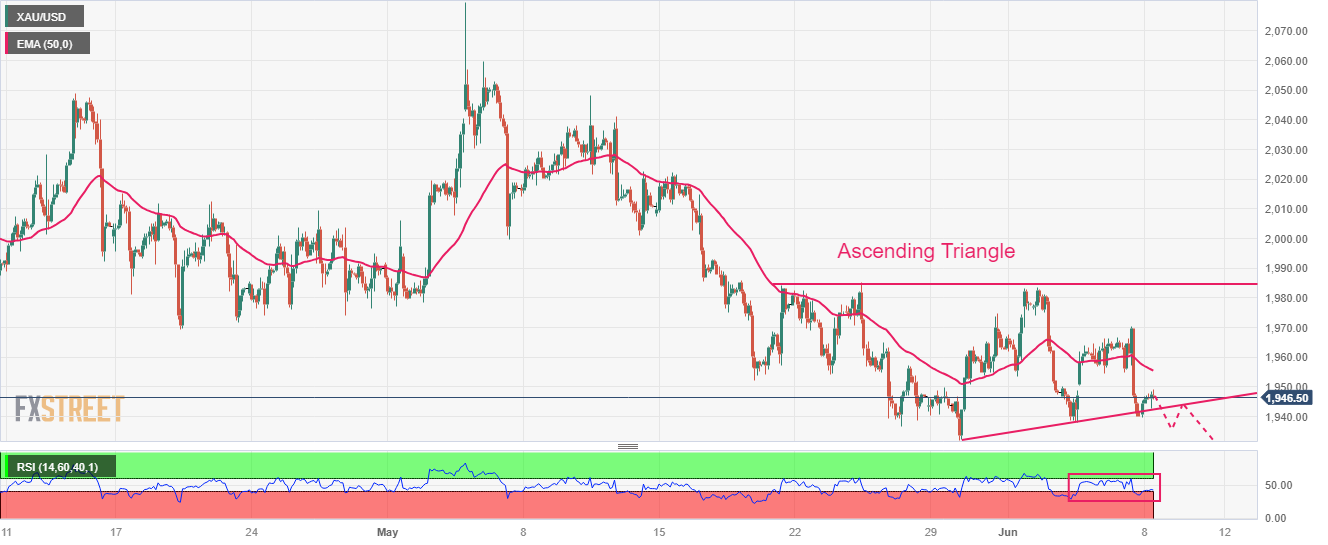
- Gold price is approaching the uptrend line of the ascending triangle pattern.
The price of Gold (XAU/USD) tries to recover after falling to close to $1,940. The precious metal has extended its rebound to near $1,950, while the DXY Dollar Index has fallen sharply. The general instability of the DXY index has kept investors on their toes. The absence of potential triggers this week has constrained the dollar index into limited territory.
S&P 500 futures have recouped their losses in full and turned positive, showing signs of recovery in market participants’ risk appetite. It appears that investors have begun to dismiss fears associated with expectations of further interest rate hikes from the Federal Reserve (Fed).
The DXY Index has found intermediate support around 103.80, however the situation for the DXY Index looks vulnerable as market sentiment has turned bright. Despite the short-term correction, dollar strength would remain as the Fed is expected to remain hawkish.
In addition, the Fed will pause in June for the first time in over a year and will keep its key interest rate at 5.00%-5.25% then and for the rest of the year.
Gold technical analysis
Gold price is hovering near the uptrend line of the ascending triangle chart pattern on the two-hour chart drawn from the May 30 low of $1,932.12. The horizontal resistance of said pattern is located from the high of May 19 at $1,983.29. The precious metal is trading below the 50 period EMA at $1,955.38, indicating that the short-term trend is down.
Meanwhile, the Relative Strength Index (RSI) (14) is having a hard time holding above 40.00.
Two hour chart gold
Source: Fx Street
I am Joshua Winder, a senior-level journalist and editor at World Stock Market. I specialize in covering news related to the stock market and economic trends. With more than 8 years of experience in this field, I have become an expert in financial reporting.


