
- US Treasury yields advance in loose trade, Wall Street is mixed.
- Dollar weakens on signs of easing US inflation and growth hopes.
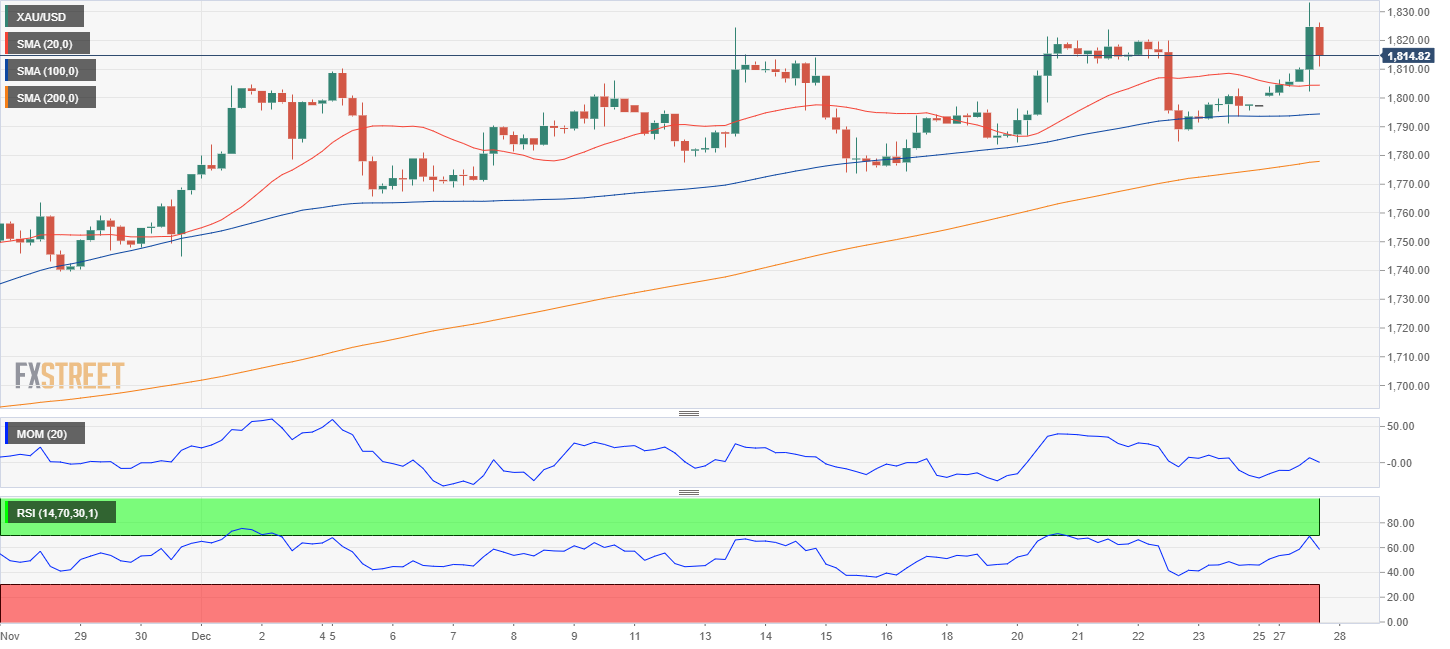
- The XAU/USD pair reached a fresh three-week high, but quickly returned to its comfort zone.
The pair XAU/USD It hit a new three-week high of $1,833.32 a troy ounce after the Wall Street open, amid improving market sentiment that keeps traders in “risk appetite” mode. Stocks rose despite tepid US data, while the dollar rallied despite firm US Treasury yields.
The bright metal’s bullish momentum faded as the session unfolded, and it pulled back towards the current $1,810 price zone, retaining its long-term bullish bias. It should be added that volumes are low heading into the end of the year, with most major and active pairs holding at known levels, despite some short-lived directional rallies.
The dollar falls in an optimistic environment
Market participants welcome the news that US inflation continues to decline, according to the core consumer price index released last Friday. Another catalyst for optimism came from China, as the country is further easing COVID-related restrictions.
From a technical point of view, according to Valeria Bednarik, chief analyst at FXStreet.com, “The daily chart shows that the pair continues to rally above all of its moving averages, with the 20 SMA (Kagi) extending its advance above the 200 SMA, in line with the prevailing uptrend.” Technical indicators, meanwhile, rallied from around their midlines, offering firm bullishness within positive levels.”
Source: Fx Street
I am Joshua Winder, a senior-level journalist and editor at World Stock Market. I specialize in covering news related to the stock market and economic trends. With more than 8 years of experience in this field, I have become an expert in financial reporting.


