
- Gold is bouncing and showing signs of resilience despite US dollar strength as lower US Treasury yields provide some support against the backdrop of US Memorial Day and European vacations.
- Optimism is soaring among investors after the provisional agreement between the White House and the US Congress to raise the US debt ceiling.
- Positive US economic data prompted a hawkish stance from the US Federal Reserve.
The price of gold pared some of its nearly 2% slide last week, rebounding from the $1,940 zone amid tight liquidity conditions due to US Memorial Day and European holidays. Lower US Treasury yields support XAU/USD, although the strength of the US dollar (USD) limits its recovery. He XAU/USD It is trading at $1,947, above its opening price by 0.08%.
Investors bullish after US debt ceiling deal; the aggressive tone of the Fed influences the markets
Investor sentiment turned positive after an agreement was reached between the White House (WH) and the US Congress. However, it remains subject to a vote as soon as possible, which would raise the US debt ceiling by two years, to January 1, 2025. This keeps US stock futures positive, although the dollar is also higher as that bets that the US Federal Reserve (Fed) will raise rates in June went from 25.7% a week ago to 58.4% today.
The reasons behind an “aggressive line” revaluation of the US Federal Reserve (Fed) come after solid retail sales, Industrial production and the upward revision of Gross Domestic Product (GDP) gave signs of resistance in the United States (US) economy. In addition, last week’s revision of the Fed’s preferred inflation gauge, the core CPI, was around 4%.
Thus, US Treasury yields, particularly the benchmark 10-year note rate, approached 3.859% before reversing course, dipping to 3.796%, a tailwind for gold prices.
Over the weekend, Chicago Fed President Austan Goolsbee said the Fed is improving on its inflation target but hasn’t, adding that interest rate hikes take months or years to develop. notice in the economy. He added that the Fed can lower inflation without causing a recession.
XAU/USD Price Analysis: Technical Perspective
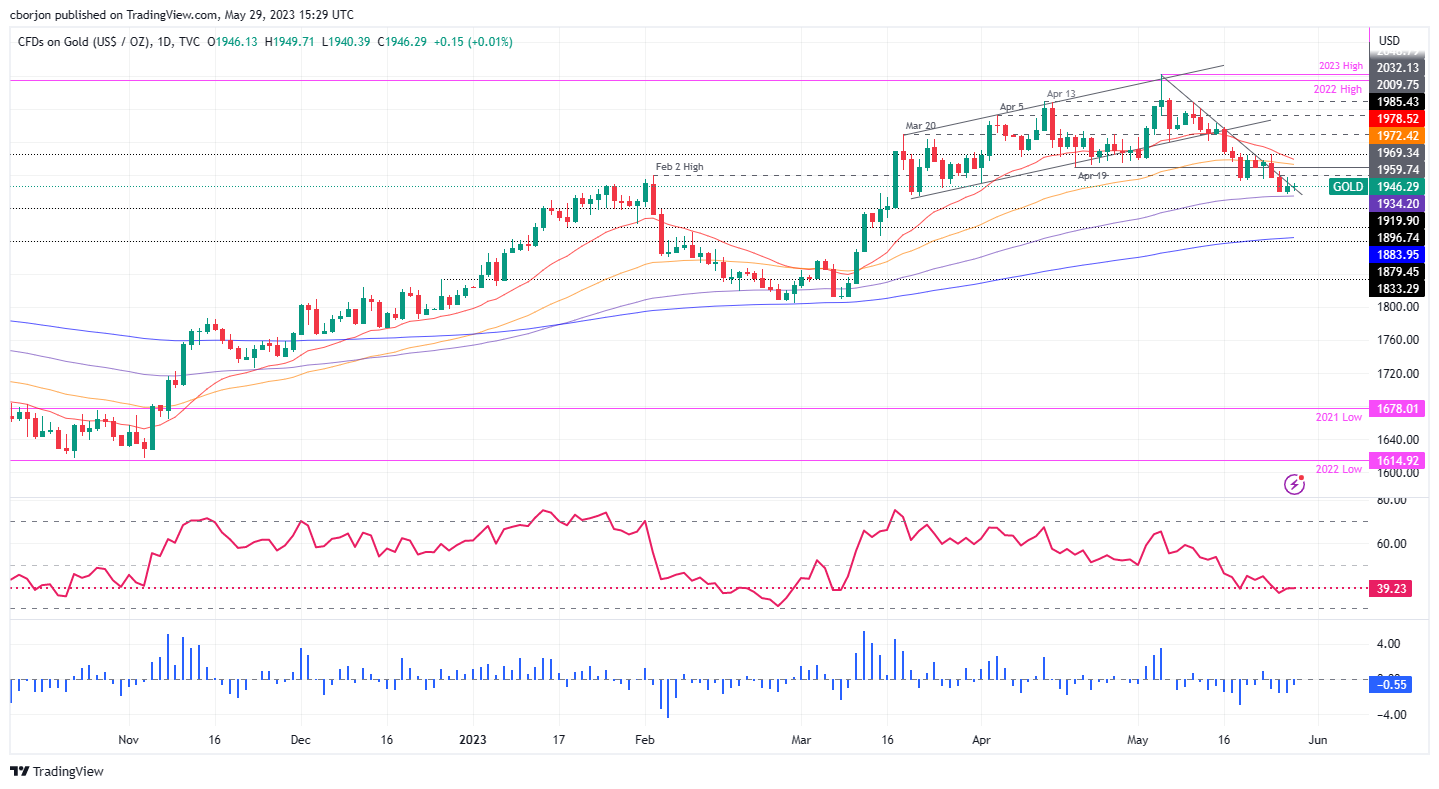
The daily chart for XAU/USD shows the yellow metal biased neutral, trapped within the confines of the 100-day EMA at $1,934.21 and the 50-day EMA at $1,972.45. In addition, the psychological level of $1,950 served as solid support that limited the fall of Gold until May 24, when it gave way to lower prices. That being said, the bulls need to recapture the latter for a bullish continuation. To the downside, if XAU/USD breaks $1,940, it could dip and test the 100 day EMA; before targeting the 200 day EMA at $1,883.95.
Source: Fx Street
I am Joshua Winder, a senior-level journalist and editor at World Stock Market. I specialize in covering news related to the stock market and economic trends. With more than 8 years of experience in this field, I have become an expert in financial reporting.


