
- Gold retreats from weekly highs, waiting to test the $1600 level, after an aggressive Fed line.
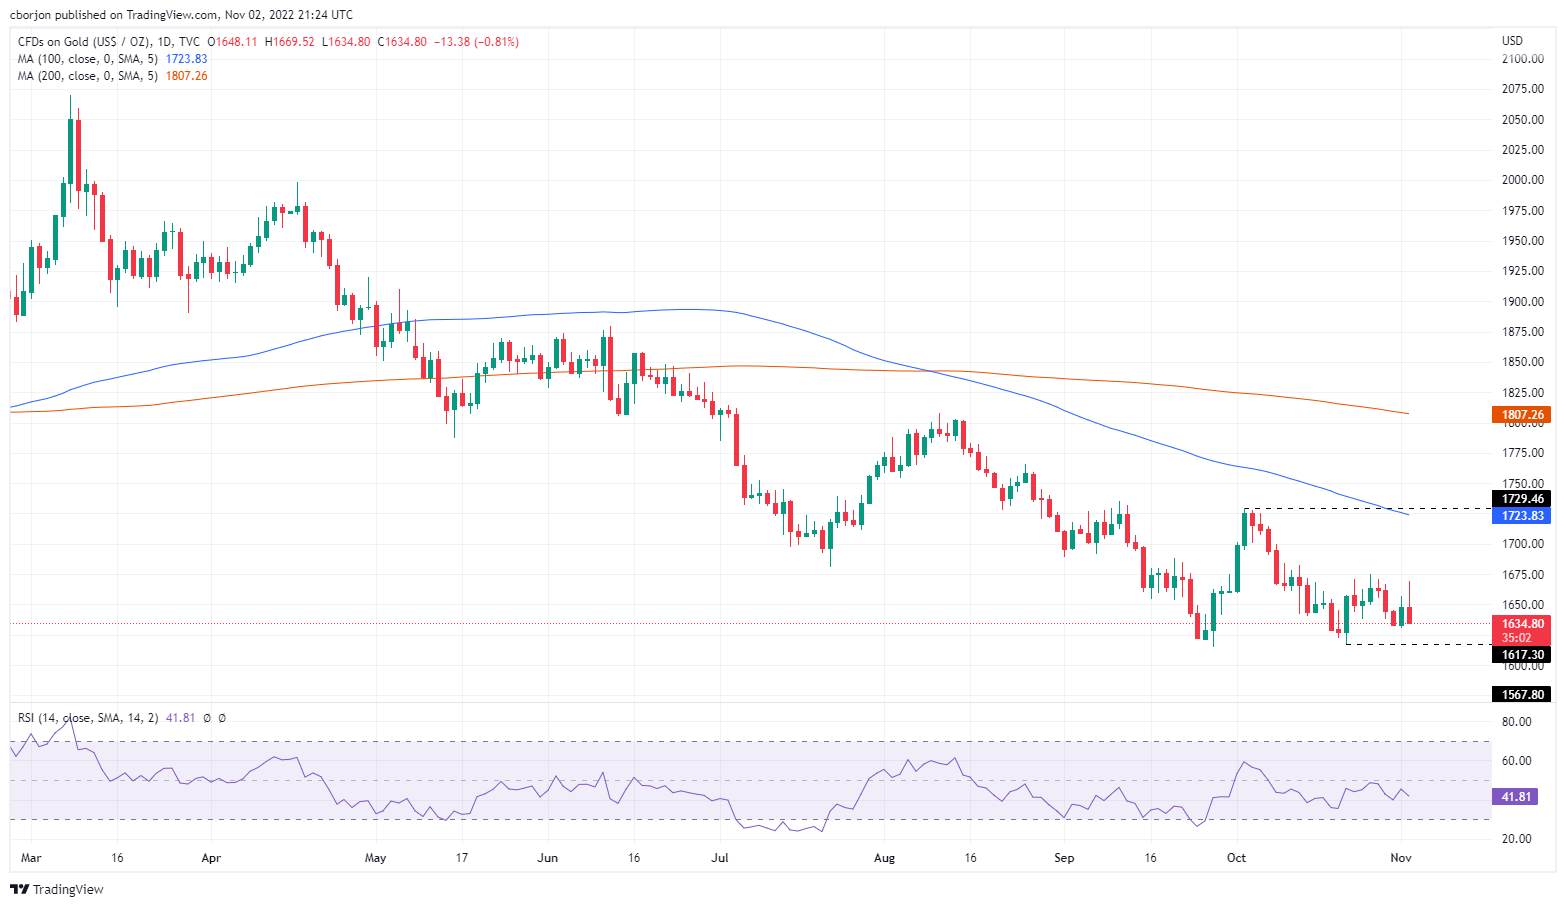
- XAU/USD hit a daily high of $1,669 before erasing its gains.
- If XAU/USD breaks the $1,617.30 support, a retest of $1,600 is expected.
the price of gold trimmed Tuesday’s gains following the release of the Federal Reserve’s November monetary policy meeting, which ended with the US central bank raising rates by 75 basis points to 3.75-4.00%, the highest level achieved since 2008, around the financial crisis. At the time of writing, XAU/USD is trading at $1,635.16, down 0.81%.
Gold Price Analysis: Technical Outlook
Following the Fed’s decision, XAU/USD remains neutrally biased to the downside, aiming to break to fresh 2-week lows below $1,634. Notably, the 20-day EMA was pierced as gold hit a fresh four-day high at $1,669.52 before pulling back to current price levels.
That being said, a triple bottom chart pattern is forming, which would be confirmed by the break of the last swing high, the daily high of Oct 4 at $1,729.48.
For this scenario to play out, XAU/USD needs to break through some key resistance levels on the daily chart. First up is the 20-day EMA at $1,656.26, followed by the 50-day EMA at $1,678.25, and the 100-day EMA at $1,723.82, before the October monthly high.
On the other hand, if XAU/USD extends its losses, the first support will be the Oct 21 low at $1,617.30. A breakout of the latter will send XAU sliding towards the March 2020 lows around $1,567.80, followed by $1,500.
XAU/USD Key Technical Levels
Source: Fx Street
With 6 years of experience, I bring to the table captivating and informative writing in the world news category. My expertise covers a range of industries, including tourism, technology, forex and stocks. From brief social media posts to in-depth articles, I am dedicated to creating compelling content for various platforms.


