
- Gold pulls back from $1,835 to test support in the $1,800 zone.
- Subdued risk appetite is weighing on demand for the precious metal.
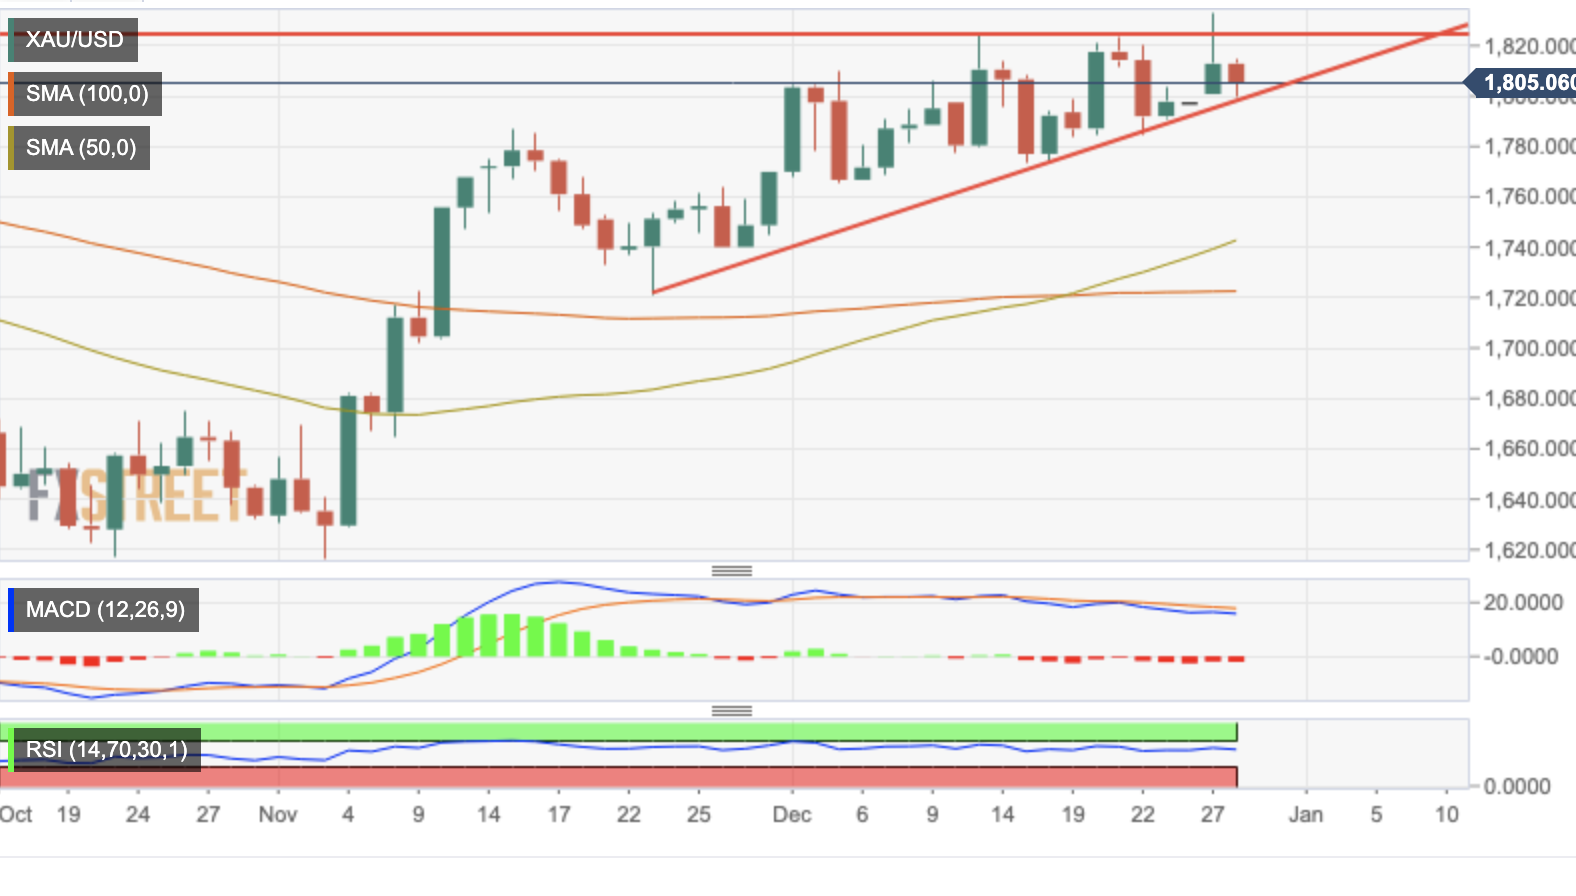
- XAU/USD, approaching the apex of an ascending triangle pattern.
gold futures They are testing support at the $1,800 signal in the European session on Wednesday, after pulling back from Tuesday’s high of $1,833. Bullion prices have held above $1,825 for the past two weeks, after a 12% recovery from mid-November lows near $1,600.
Gold loses ground amid subdued risk appetite
The precious metal traded lower on Tuesday, giving back gains after rallying to $1,835 on Tuesday. Modestly positive market sentiment, sparked by news that China is lifting quarantine for incoming travelers, has lifted market sentiment in an otherwise quiet post-Christmas market.
Elsewhere, the US dollar continues to pull back, with the Dollar Index shedding 0.2% on the daily charts and trading just above the 104.00 level, after a moderately positive open, which sent the DXY to session highs at 104.35. .
XAU/USD moves in an ascending triangle pattern
From a technical point of view, the daily chart shows the pair approaching the apex of an ascending triangle pattern, capped by a resistance zone at $1,825, and trend line support from the late November lows, now around $1,795.
With the MACD indicator in negative territory, a confirmation below the mentioned $1,795 would nullify the uptrend and boost sellers’ confidence to push the pair towards $1,765/$75, the lows of December 6 and 15, and the low of on November 23 at $1,720.
Conversely, a rally above the $1,825/$35 resistance zone would confirm the bullish pattern and put the pair targeting a June high of $1,880 before the $1,900 psychological level.
XAU/USD daily chart
Technical levels to watch
Source: Fx Street
I am Joshua Winder, a senior-level journalist and editor at World Stock Market. I specialize in covering news related to the stock market and economic trends. With more than 8 years of experience in this field, I have become an expert in financial reporting.


