
- Gold prices attract some sellers in early Asian trading on Tuesday.
- Rising bets of a US rate cut this year and escalating geopolitical conflicts could limit gold’s downside.
- Investors will be watching the US CB Consumer Confidence data and the House Price Index, due out on Tuesday.
Gold (XAU/USD) price is trading in negative territory amid the modest recovery of the US Dollar (USD) on Tuesday. However, US Federal Reserve (Fed) Chairman Jerome Powell’s signal at Jackson Hole to start cutting interest rates is likely to support the precious metal. Lower interest rates are generally positive for gold as they reduce the opportunity cost of holding non-interest-paying assets. Moreover, rising geopolitical tensions in the Middle East could further boost Gold, a traditional safe haven asset.
The People’s Bank of China (PBOC) halted gold purchases in July, marking the third consecutive month it did not purchase for reserves. Traders will be looking to August data for fresh impetus. Concerns over the sluggish economy and demand for precious metals in China could drag the price of gold lower, as China is the largest producer and consumer of gold in the world.
The US Conference Board consumer confidence for August and the house price index for June will be released on Tuesday. Later in the week, the US preliminary annualized gross domestic product (GDP) for the second quarter and personal consumption expenditure (PCE) price index data will be in focus.
Daily Market Drivers Roundup: Gold Price Loses Traction, Downside Potential Appears Limited
- Hamas rejects new Israeli conditions at ceasefire talks in Egypt and insists that Israel be bound by the terms of a proposal put forward by US President Joe Biden and the UN Security Council, according to local news agency Aljazeera.
- San Francisco Federal Reserve Bank President Mary Daly said it was appropriate for the Fed to begin cutting interest rates, adding that she did not want to continue tightening policy as inflation eased.
- Richmond Fed President Thomas Barkin has signaled he will take a “test and learn” approach to rate cuts.
- Fed Chairman Jerome Powell said Friday at the Kansas City Fed’s annual economic symposium in Jackson Hole, “The time has come to tighten policy.” Powell also said he was confident inflation was heading toward the Fed’s 2% target.
- US durable goods orders rose 9.9% month-on-month in July from a -6.9% contraction in June, stronger than the 4% increase expected. This figure registered the largest increase since May 2020.
- According to the CME FedWatch tool, markets have fully priced in a 25 basis point (bps) rate cut, while the chance of a deeper rate cut stands at 30%, down from 36.5% last Friday.
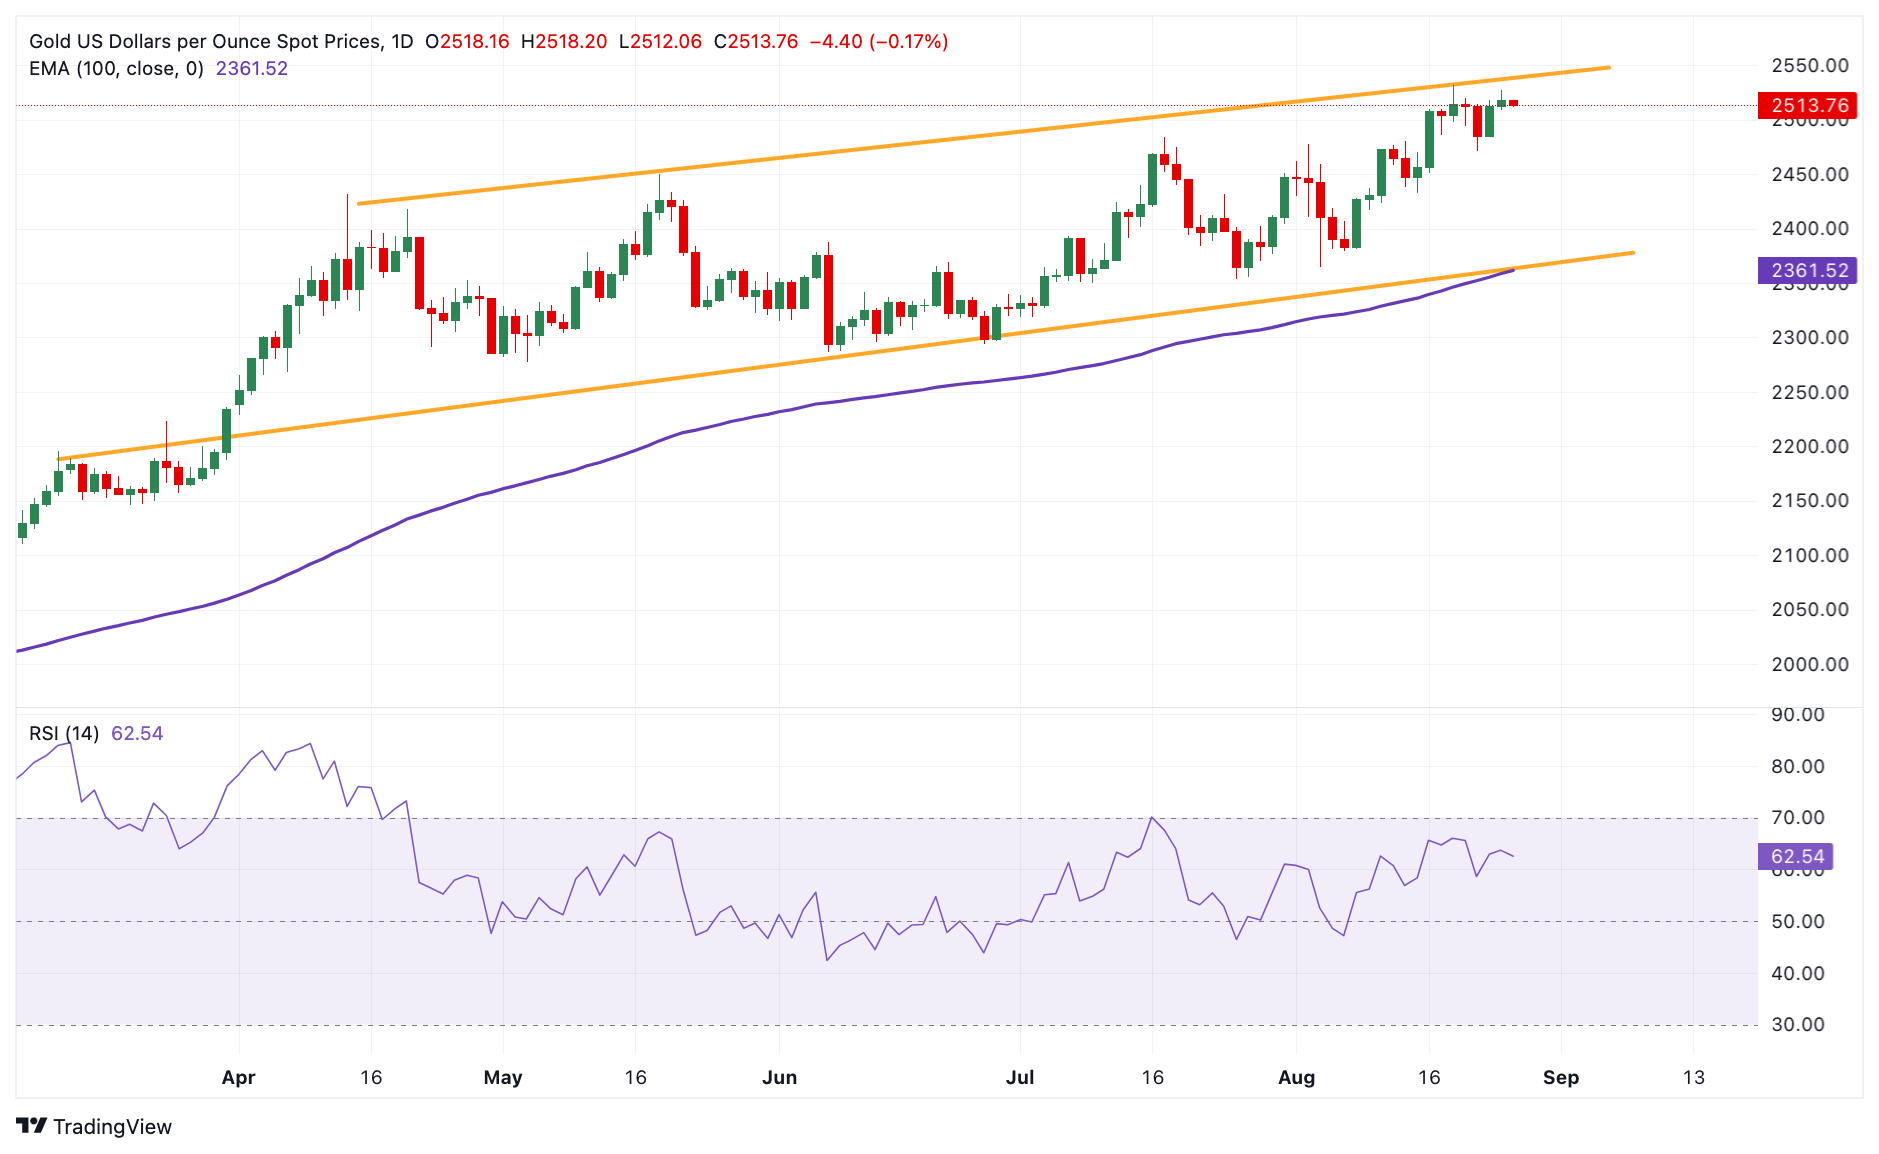
Technical Analysis: The broader bullish outlook for gold price remains intact
Gold price is down on the day. The yellow metal remains capped below the upper boundary of a five-month-old ascending channel. However, a broader bullish outlook prevails as the precious metal is well supported above the 100-day exponential moving average (EMA) on the daily chart. The 14-day relative strength index (RSI) is holding above the midline near 92.95, indicating sustained strength.
If Gold breaks the resistance areas and sees sustainable bullish candles above the $2,530-$2,540 zone, the all-time high and the upper boundary of the trend channel, the XAU/USD could target the psychological level of $2,600.
On the other hand, any further selling below the August 22 low at $2,470 could attract more technical sellers and push gold towards the next support zone at $2,432, the August 15 low. The key containment level to watch is the $2,360-$2,370 zone, the lower boundary of the trend channel and the 100-day EMA.
US Dollar Price This Week
The table below shows the percentage change of the US Dollar (USD) against the major currencies listed this week. The US Dollar was the weakest against the Canadian Dollar.
| USD | EUR | GBP | CAD | AUD | JPY | NZD | CHF | |
| USD | 0.19% | 0.15% | -0.22% | 0.21% | 0.17% | 0.24% | -0.10% | |
| EUR | -0.20% | -0.05% | -0.42% | 0.01% | -0.02% | 0.05% | -0.29% | |
| GBP | -0.15% | 0.03% | -0.37% | 0.05% | 0.02% | 0.11% | -0.25% | |
| CAD | 0.22% | 0.41% | 0.38% | 0.42% | 0.43% | 0.47% | 0.12% | |
| AUD | -0.19% | 0.00% | -0.05% | -0.43% | -0.02% | 0.05% | -0.28% | |
| JPY | -0.18% | 0.02% | -0.04% | -0.43% | 0.00% | 0.02% | -9927.67% | |
| NZD | -0.24% | -0.07% | -0.09% | -0.47% | -0.04% | -0.07% | -0.35% | |
| CHF | 0.08% | 0.29% | 0.25% | -0.12% | 0.31% | 0.28% | 0.35% |
The heatmap shows the percentage changes of the major currencies relative to each other. The base currency is chosen from the left column, while the quote currency is chosen from the top row. For example, if you choose the Euro from the left column and move along the horizontal line to the Japanese Yen, the percentage change shown in the chart will represent EUR (base)/JPY (quote).
Source: Fx Street
I am Joshua Winder, a senior-level journalist and editor at World Stock Market. I specialize in covering news related to the stock market and economic trends. With more than 8 years of experience in this field, I have become an expert in financial reporting.


