
- The price of Gold reaches a daily high of $1,996.73, but loses momentum following the publication of a mixed report on inflation in the United States.
- The US Bureau of Labor Statistics (BLS) reveals a moderation in inflation in the country.
- Traders are awaiting the Federal Reserve’s decision, and futures markets expect the Fed to hold rates on hold, with an eye on a 100 basis point cut by 2024.
Gold price lost its shine after hitting a daily high of 1,996.73, although it fell in the wake of a subdued inflation report in the United States (US), ahead of the Fed’s next monetary policy decision Federal (Fed). XAU/USD trades at $1,979.40, losing 0.11% on the day.
The yellow metal loses momentum ahead of the Fed’s next decision
The US Bureau of Labor Statistics (BLS) revealed that the process of disinflation in the US continues, as headline inflation was 3.1% year-on-year, down from 3.2% in October, but core inflation was remains firmer at 4% in the twelve months to November. The monthly data was mixed: the CPI stood at 0.1%, exceeding forecasts by 0%, while the core CPI was 0.3%, as expected, but higher than in October.
The release of the data propelled Gold towards its daily high, although it trimmed its gains, falling below the $1985 zone, weighed down by a recovery in US Treasury yields. Even though The Dollar continues to appear weak, as shown by the Dollar Index (DXY), which fell 0.23% to 103.85, the yellow metal still unable to recover from its latest losses.
Meanwhile, traders are preparing for the Federal Reserve’s decision on Wednesday, followed by Chairman Jerome Powell’s press conference. Despite the positive inflation reading, money market futures have priced in 100 basis points of rate cuts by 2024 and remain cautious. That same day, the BLS will announce the prices paid by producers.
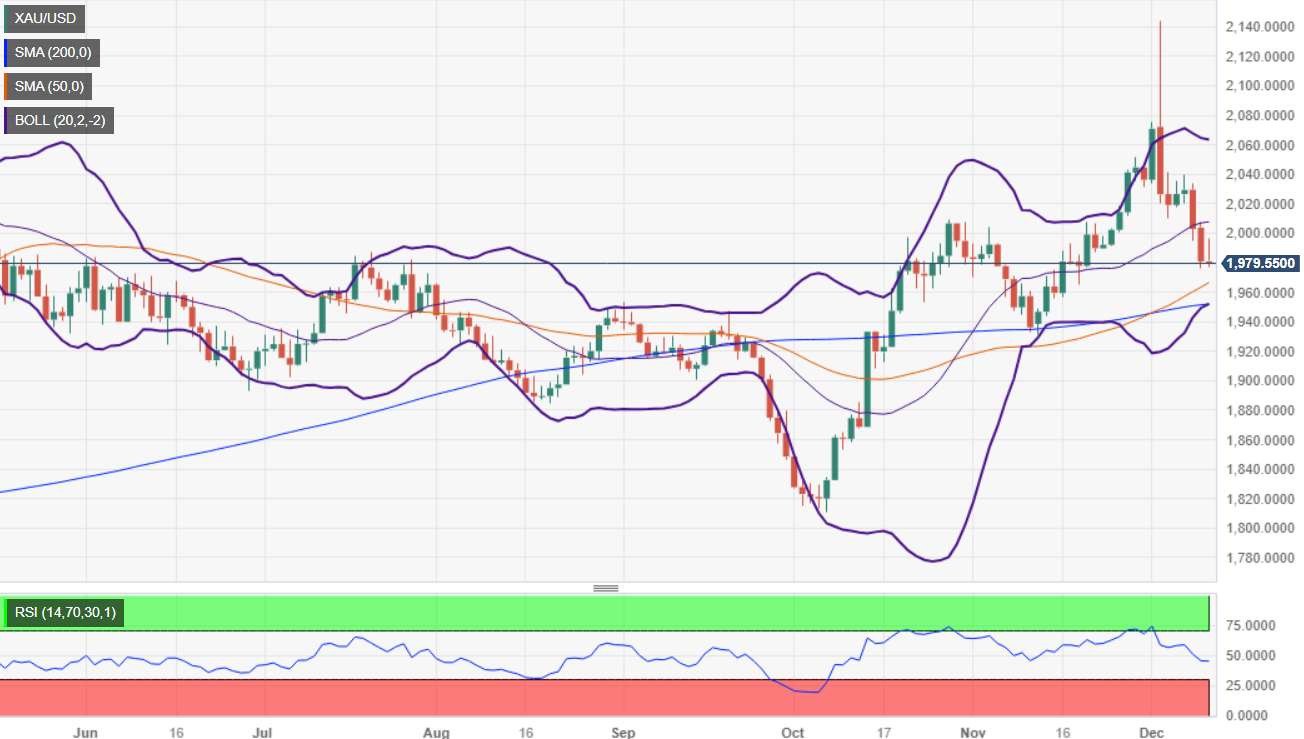
XAU/USD Price Analysis: Technical Outlook
The daily gold chart shows yellow metal with a neutral to bullish bias as long as it remains above the daily moving averages (DMA). However, if XAU/USD continues to fall, the 50-DMA at 1,966.41 would come into play, followed by the 200-DMA at 1,952.74. Additional support lies at the 100-DMA at 1941.07. Once these levels are surpassed, the XAU/USD would move lower. On the other hand, a bullish resumption is in sight, but the bulls need to lift the spot price above the October 27 high of 2,009.42.
Source: Fx Street
I am Joshua Winder, a senior-level journalist and editor at World Stock Market. I specialize in covering news related to the stock market and economic trends. With more than 8 years of experience in this field, I have become an expert in financial reporting.


.jpg "Chronic obstructive bronchopneumopathy, give me the La TV series to get to know a disease better that represents the third cause of death in the world")

