
- The price of gold rises to about $ 3,370 due to slight correction in the US dollar.
- Traders reduce moderate bets on the Fed, after the US CPI report for June.
- The impact of Trump’s tariffs has begun to influence the economy.
The price of gold (Xau/USD) advances about $ 3,370 during the European trading session on Monday. The precious metal gains as the US dollar (USD) corrects after not being able to extend its recent upward movement. Technically, a lower US dollar makes the price of gold an attractive bet for investors.
At the time of writing, the dollar index (DXY), which follows the value of the dollar against six main currencies, goes back about 98.15 from the maximum of four weeks around 99.00.
American dollar today
The lower table shows the percentage of US dollar change (USD) compared to the main coins today. US dollar was the weakest currency against pound sterling.
| USD | EUR | GBP | JPY | CAD | Aud | NZD | CHF | |
|---|---|---|---|---|---|---|---|---|
| USD | -0.25% | -0.38% | -0.24% | -0.07% | -0.04% | 0.10% | -0.24% | |
| EUR | 0.25% | -0.06% | 0.02% | 0.16% | 0.17% | 0.16% | -0.03% | |
| GBP | 0.38% | 0.06% | -0.14% | 0.27% | 0.26% | 0.44% | 0.23% | |
| JPY | 0.24% | -0.02% | 0.14% | 0.18% | 0.23% | 0.28% | 0.17% | |
| CAD | 0.07% | -0.16% | -0.27% | -0.18% | 0.09% | 0.17% | -0.22% | |
| Aud | 0.04% | -0.17% | -0.26% | -0.23% | -0.09% | 0.07% | -0.07% | |
| NZD | -0.10% | -0.16% | -0.44% | -0.28% | -0.17% | -0.07% | -0.22% | |
| CHF | 0.24% | 0.03% | -0.23% | -0.17% | 0.22% | 0.07% | 0.22% |
The heat map shows the percentage changes of the main currencies. The base currency is selected from the left column, while the contribution currency is selected in the upper row. For example, if you choose the US dollar of the left column and move along the horizontal line to the Japanese yen, the percentage change shown in the box will represent the USD (base)/JPY (quotation).
The US dollar faces sales pressure despite the fact that traders see a lower probability that the Federal Reserve (FED) cuts interest rates in the September monetary policy meeting. According to the CME Fedwatch tool, the probability that the FED reduces interest rates at the September meeting has decreased to 58.5% from almost 70% seen a month ago. The tool also shows that the Fed will keep the stable interest rates at the policy meeting scheduled for next week.
Traders reduce moderate bets on the Fed after the publication of the United States Consumer Price Index (IPC) (USA) for June, which showed that the impact of sectoral tariffs imposed by President Donald Trump has begun to be reflected in prices.
Technical Gold Analysis
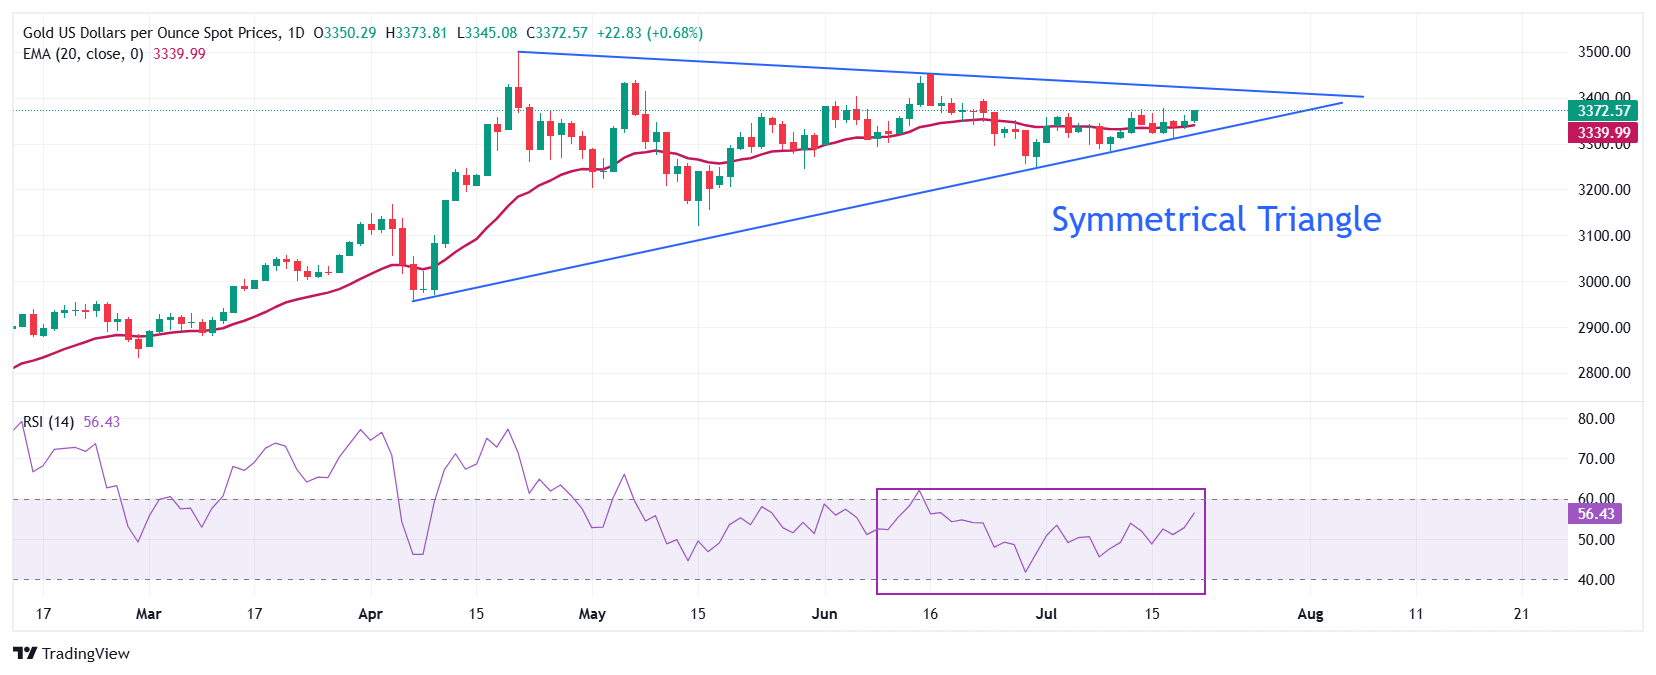
The price of gold is quoted in a symmetrical triangle formation in a daily temporal framework, indicating a contraction of volatility. The ascending trend line of the graphic pattern mentioned above is placed from the minimum of May 15, $ 3,120.83, while its descending edge is drawn from the maximum of April 22 around $ 3,500.
The exponential (EMA) mobile average of 20 days around $ 3,340 acts as a key support area for the price of gold.
The 14-day relative force (RSI) index oscillates within the range of 40.00-60.00, indicating a lateral trend.
Looking up, the price of gold will enter an unexplored territory if it breaks decisively above the psychological level of $ 3,500. Potential resistances would be $ 3,550 and $ 3,600.
Alternatively, the price of gold would fall towards the round level support of $ 3,200 and the minimum of May 15 in $ 3,121, if it breaks below the minimum of May 29, $ 3,245.
Daily Gold Graph
GOLD – FREQUENT QUESTIONS
Gold has played a fundamental role in the history of mankind, since it has been widely used as a deposit of value and a half of exchange. At present, apart from its brightness and use for jewelry, precious metal is considered an active refuge, which means that it is considered a good investment in turbulent times. Gold is also considered a coverage against inflation and depreciation of currencies, since it does not depend on any specific issuer or government.
Central banks are the greatest gold holders. In their objective of supporting their currencies in turbulent times, central banks tend to diversify their reserves and buy gold to improve the perception of strength of the economy and currency. High gold reserves can be a source of trust for the solvency of a country. Central banks added 1,136 tons of gold worth 70,000 million to their reservations in 2022, according to data from the World Gold Council. It is the largest annual purchase since there are records. The central banks of emerging economies such as China, India and Türkiye are rapidly increasing their gold reserves.
Gold has a reverse correlation with the US dollar and US Treasury bonds, which are the main reserve and shelter assets. When the dollar depreciates, the price of gold tends to rise, which allows investors and central banks to diversify their assets in turbulent times. Gold is also inversely correlated with risk assets. A rebound in the stock market tends to weaken the price of gold, while mass sales in higher risk markets tend to favor precious metal.
The price of gold can move due to a wide range of factors. Geopolitical instability or fear of a deep recession can cause the price of gold to rise rapidly due to its condition of active refuge. As an asset without yield, the price of gold tends to rise when interest rates lower, while the money increases to the yellow metal. Even so, most movements depend on how the US dollar (USD) behaves, since the asset is quoted in dollars (Xau/USD). A strong dollar tends to keep the price of gold controlled, while a weakest dollar probably thrusts gold prices.
Source: Fx Street
I am Joshua Winder, a senior-level journalist and editor at World Stock Market. I specialize in covering news related to the stock market and economic trends. With more than 8 years of experience in this field, I have become an expert in financial reporting.


