
Google has updated a chart showing the percentage of devices running different versions of Android. The most interesting thing is that there is still no data on the extent of distribution of Android 12.
Previously, the search giant released this information every month in the form of a pie chart, but this data ultimately did the company a disservice. They have often been used to compare with the faster adoption rates of new versions of iOS. Over time, such diagrams began to be updated much less frequently, and then they completely ceased to appear in the information field.
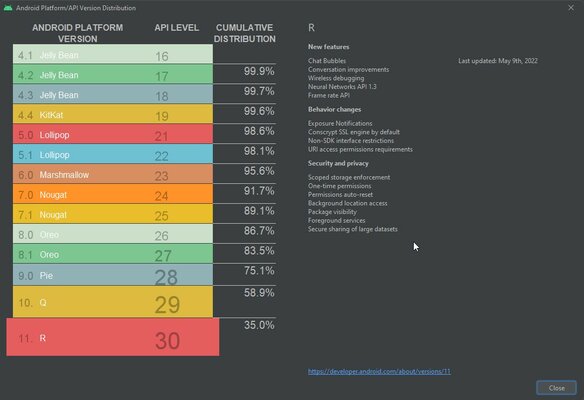
More recently, Google has included Android distribution information in the Android Studio development environment to show what percentage of devices are running a particular version of the system. This data is now updated approximately every six months or a year. According to the updated chart for 2022, the number of devices running Android 11 is 28.3%. Last time this figure was 24.2%. The share of devices using Android 10 dropped to 23.9%. A similar decline is seen with other versions of Android, with Jelly Bean (4.1-4.3) still holding 0.4%.
The lack of statistics for Android 12 in this chart is likely due to the fact that the information is intended for developers. To help decide which versions of Android they should stick to. Using the chart, developers can find out what percentage of potential customers they might lose if they don’t support an older version of Android. Therefore, information about how many devices are currently running Android 12 does not really matter. But ordinary users would be interested to see such an infographic.
Source: Trash Box
Donald-43Westbrook, a distinguished contributor at worldstockmarket, is celebrated for his exceptional prowess in article writing. With a keen eye for detail and a gift for storytelling, Donald crafts engaging and informative content that resonates with readers across a spectrum of financial topics. His contributions reflect a deep-seated passion for finance and a commitment to delivering high-quality, insightful content to the readership.


