Bitcoin
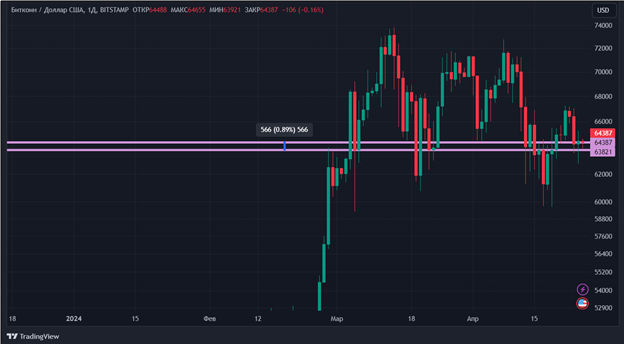
Bitcoin rose in price by less than 1% in the week from April 19 to April 26. The seven-day period turned out to be as smooth as possible: four sessions of falling and three sessions of growth. At the maximum for the specified period, Bitcoin cost $67,241, at the minimum – $62,785.
Source: tradingview.com
The past halving did not become the root cause of the rally of the largest cryptocurrency. Therefore, macro data began to have a major influence on investor sentiment. This week, statistics on US GDP were published. They hardly added positive news to investors. Gross domestic product in the first quarter of 2024 increased by only 1.6%, compared with the forecast of 2.5% and 3.4% observed in the fourth quarter of 2023. But the GDP price index, which measures inflation in goods and services, turned out to be higher than expected and amounted to 3.1%. This is significantly higher than the 1.6% shown in the fourth quarter of 2023. Such
indicators destroying investors' hopes for a reduction in the US Federal Reserve's key rate in the near future. That is, loans will not become cheaper.
Some negativity is also coming from spot Bitcoin ETFs. Interesting statistics in X (formerly Twitter)
brought Bloomberg Intelligence senior analyst Erick Balchunas:
“GBTC Grayscale is on a streak of 72 days of outflows, no other ETF has ever seen anything close to this. #1 of all time.”
Representatives of the analytical
platforms CryptoQuant built a forecast model for the price of Bitcoin for the next 25 and 30 days. The experiment took place using artificial intelligence technology. Analysts downloaded 376 on-chain BTC indicators for analysis starting in 2012. Based on the results of building the model, it turned out that in 25 days Bitcoin should return to $70,000, and after 30 it will exceed the historical maximum ($73,794) and reach $78,000.
Representatives of CryptiQuant
notedthat this data in no way constitutes an investment recommendation or a guide to action. It will be possible to tell how accurate the CryptoQuant model is already in May 2024.
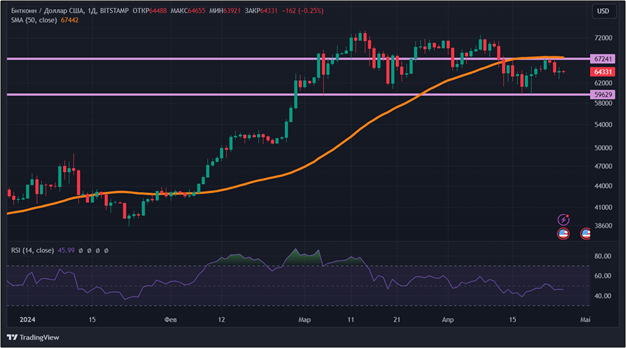
From the point of view of technical analysis, Bitcoin remains flat. At the same time, indicators indicate the predominance of bearish sentiment: the price is below the 50-day moving average (indicated in orange), RSI is below 50. The nearest resistance and support levels are: $67,241 and $59,629, respectively.
Source: tradingview.com
Index
fear and greed increased by four points compared to last week. Its value is now 70. This still suggests that greed prevails over fear among Bitcoin investors.
Ethereum
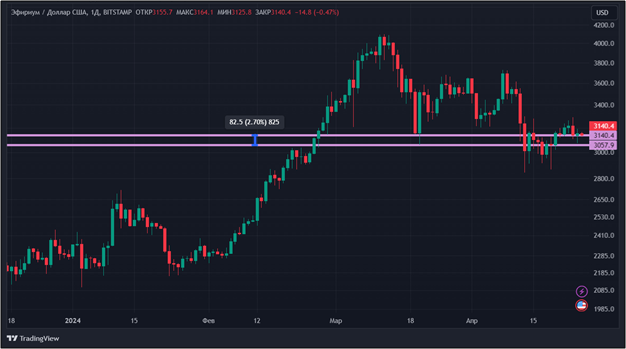
Ether rose in price by 2.7% over the week. At the same time, the week was clearly divided into two halves: first (in the first four days) ETH rose to almost $3,300, and then fell below $3,150. Volatility remains quite low: the price change in all trading sessions did not reach 3.5%.
Source: tradingview.com
It would seem that the halving took place for Bitcoin, but the amount of ether in staking began to increase. If before the reduction in the reward for mining a BTC block, the figure was just under 31.6 million ETH, then by April 26 it reached almost 31.9 million. In other words, about 300,000 ETH were deposited in less than six days.

Source: beaconcha.in
But the American Securities and Exchange Commission (SEC) is in no hurry to follow the experience of its colleagues from Hong Kong: this week the regulator officially postponed the decision on several applications at once. Among the losers were ETFs from
Franklin Templeton,
Grayscaleas well as amendments to the original proposal
BlackRock. For all applications, the deadlines for making specific decisions have been extended. Franklin Templeton will wait until at least June 11, BlackRock 21 days, and Grayscale 60 days as they consider converting the current trust into a spot ETF for ether.
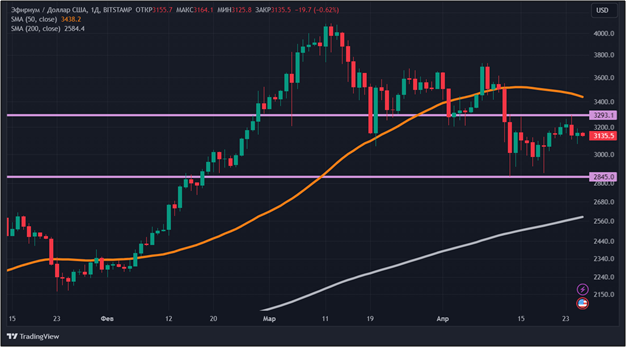
From a technical analysis perspective, Ethereum remains in a downtrend in the short term, with the price positioned below the 50-day moving average (in orange). But in the long term the opposite is true, as the 200-day moving average (in grey) is much lower than the current price. To exit the downtrend, it is necessary to overcome the resistance level around $3,300. The support level is $2,845.
Source: tradingview.com
Solana
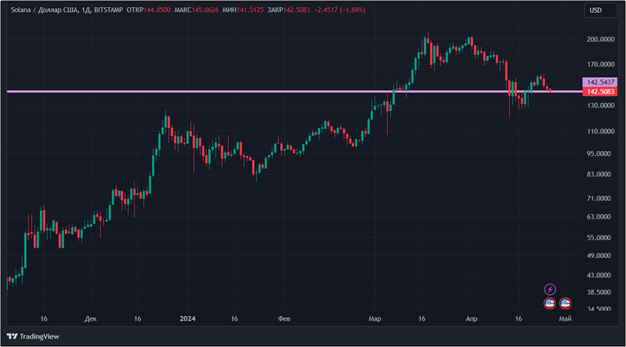
The price of the Solana cryptocurrency has remained virtually unchanged over the past seven days and is still just over $142.5. The last four trading sessions were unsuccessful: the coin fell in price by almost 10%.
Source: tradingview.com
Although the price of Solana is not growing, the platform itself shows quite good results, being a leader in some indicators. An interesting statistic
brought at X, co-founder of the venture capital company Placeholder Chris Burniske:
“While Tron and BSC (Binance Smart Chain) lead the active addresses in stablecoin transfers, Ethereum and Solana lead in dollar volume of stablecoin transfers.”
From this we can conclude that the Solana blockchain is preferred by large players (whales), while Tron and BSC are the choice of retail traders.
Indirect confirmation was a report presented by the head of the research department of CoinShares, James Butterfill. It provides statistics on investor preferences. Bitcoin is still in first place, and ether is in second. Although the appetite for the latter has seriously diminished. But recently it has begun to grow
demand on other altcoins, especially Solana.
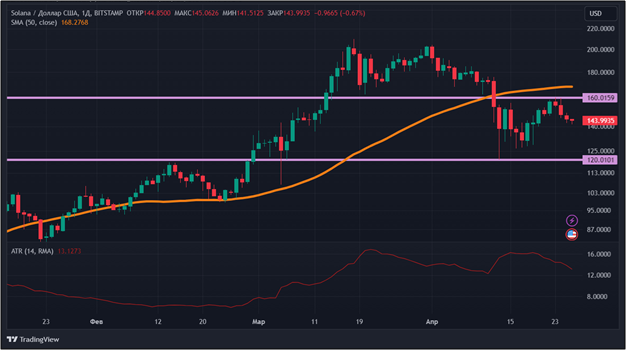
According to technical analysis, SOL is currently in correction. The coin has fallen for the fourth day in a row (since April 23). Indicators are also bearish, with the price below the 50-day moving average (in orange). There has been a decrease in volatility, as evidenced by the drop in the ATR indicator in the last seven days. Support and resistance levels: $120 and $160 respectively.
Source: tradingview.com
Conclusion
Cryptocurrency prices changed slightly during the week from April 19 to April 26. High inflation in the US does not promise a quick reduction in the Fed's key rate, and the SEC does not want to make quick decisions on spot ETFs for ether. This causes uncertainty among investors, which is reflected in low volatility.
This material and the information contained herein do not constitute individual or other investment advice. The opinion of the editors may not coincide with the opinions of the author, analytical portals and experts.
Source: Bits
I am an experienced journalist, writer, and editor with a passion for finance and business news. I have been working in the journalism field for over 6 years, covering a variety of topics from finance to technology. As an author at World Stock Market, I specialize in finance business-related topics.


