
- The Dow Jones falls 0.03% today.
- The Nasdaq 100 rose 1.70% on Wednesday.
- The S&P 500 rises 0.83% daily.
The Dow Jones fell 0.03%, currently trading above 44,253, tying five consecutive sessions with losses.
The Dow Jones Industrial Average began trading at 44,257, while the Nasdaq 100 technology index began trading at 21,384. The S&P 500 opened at 6,042, hitting a two-day high of 6,079.
UnitedHealth and Travelers drag the Dow Jones into the negative zone
The Dow Jones Industrial Average is currently trading at 44.253, down 0.03%, reaching November 22 lows of 44.142.
UnitedHealth (UNH) shares resume the bearish outlook and plummet 5.02% today, reaching July 16 lows of $533.70. On the other hand, Travelers (TRV) shares are experiencing their fourth consecutive session of decline, falling 1.98% daily, reaching the lows of October 16 at $241.80.
Broadcom and Marvell Technology drive Nasdaq 100 to new all-time highs
The Nasdaq 100 technology index rose 1.70% on Wednesday, reaching new all-time highs at 21,736.
Broadcom (AVGO) stock is up 6.26% today, hitting highs not seen since Nov. 11 at $182.85. AVGO’s rebound comes prior to the publication of its quarterly report, in which analysts’ projections expect the company to achieve revenue of $14.07 billion and earnings per share of $1.39. In the same vein, Marvell Technology (MRVL) shares register a gain of 3.85%, reaching two-day highs of $111.31.
The S&P 500 operates in positive territory after the US inflation data
The S&P 500 index rises 0.83% on the day, reaching two-day highs of 6,085 after the release of the US CPI.
According to information from the Department of Labor, the Consumer Price Index stood at 2.7% year-on-year in November, in line with market estimates and slightly higher than the 2.6% recorded in October. On the other hand, underlying inflation that excludes food and energy stood at 3.3% in the same period, in line with previous and estimated figures.
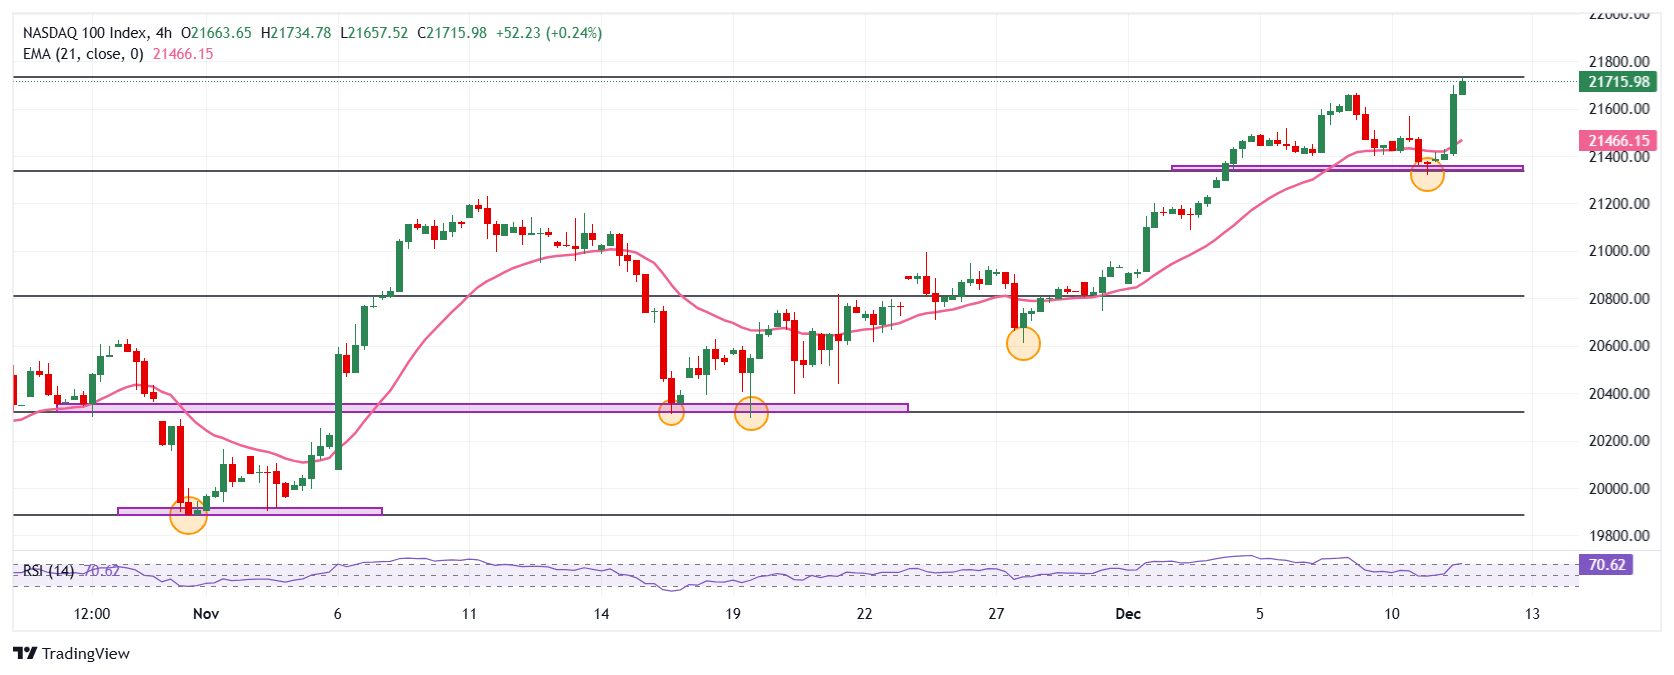
Technical analysis of the Nasdaq 100
The Nasdaq 100 formed short-term support given by the December 10 low at 21,319, converging with the 78.6% Fibonacci retracement. The next key support when we look at it at 20,293 November 19 low in line with the 23.6% Fibonacci retracement.
Nasdaq 100 4-hour chart
The Dow Jones FAQs
The Dow Jones Industrial Average, one of the world’s oldest stock indices, is made up of the 30 most traded securities in the United States. The index is weighted by price rather than capitalization. It is calculated by adding the prices of the securities that comprise it and dividing them by a factor, currently 0.152. The index was founded by Charles Dow, also founder of the Wall Street Journal. In recent years it has been criticized for not being sufficiently representative, since it only follows 30 companies, unlike broader indices such as the S& P 500.
There are many factors that drive the Dow Jones Industrial Average (DJIA). The main one is the aggregate performance of its component companies, revealed in quarterly corporate earnings reports. US and global macroeconomic data also contribute, influencing investor sentiment. The level of interest rates, set by the Federal Reserve (Fed), also influences the DJIA, as it affects the cost of credit, on which many companies largely depend. Therefore, inflation can be a determining factor, as well as other parameters that influence the decisions of the Federal Reserve.
The Dow Theory is a method for identifying the main trend of the stock market developed by Charles Dow. A key step is to compare the direction of the Dow Jones Industrial Average (DJIA) and the Dow Jones Transportation Average (DJTA) and only follow trends where they are both moving in the same direction. Volume is a confirmation criterion. The theory uses elements of maximum and minimum analysis. The Dow theory proposes three phases of the trend: accumulation, when the smart money begins to buy or sell; public participation, when the general public joins the trend; and distribution, when the smart money abandons the trend.
There are several ways to trade the DJIA. One of them is to use ETFs that allow investors to trade the DJIA as a single security, instead of having to buy shares of the 30 companies that comprise it. A notable example is the SPDR Dow Jones Industrial Average ETF (DIA). Futures contracts on the DJIA allow traders to speculate on the future value of the index, and options provide the right, but not the obligation, to buy or sell the index at a predetermined price in the future. Mutual funds allow investors to purchase a portion of a diversified portfolio of DJIA securities, providing exposure to the global index.
Source: Fx Street
I am Joshua Winder, a senior-level journalist and editor at World Stock Market. I specialize in covering news related to the stock market and economic trends. With more than 8 years of experience in this field, I have become an expert in financial reporting.


