
- Nasdaq 100 retraces part of Friday’s gains and falls towards the 15,450 point area on Monday.
- Fed Chairman Jerome Powell and his colleagues left the door open to further rate hikes in the future.
- The focus this week will be on the US Consumer Price Index (CPI) data that will be published on Tuesday.
The Nasdaq 100 index retraces part of Friday’s strong gains and falls towards the 15,450 point area on Monday. At the time of writing, the Nasdaq is trading at 15,462, losing about 0.40% on the day.
The Nasdaq gained 2.27% on Friday to end the week with a gain of 2.73%, the second consecutive weekly gain after gaining 5.54% the previous week.
At the time of writing, the Nasdaq has recovered more than 1,400 points since falling to a low of 14,057 on October 26. Since that time, the index has shown 10 green candles of the last 11 until marking a new high on the daily chart, breaking the bearish trend seen since mid-July, and rising to levels not seen since mid-September.
Nasdaq daily chart
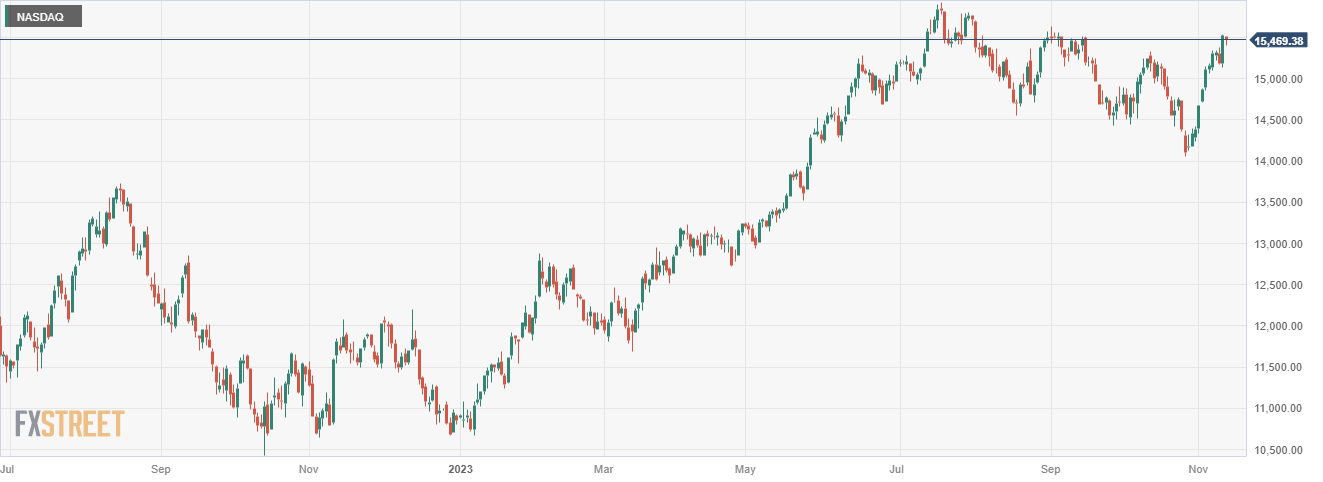
The recovery from the aforementioned low gained strength after the US Federal Reserve (Fed) decided to leave its interest rate unchanged in the range of 5.25%-5.50% and the US non-farm payrolls report. The U.S. (NFP) showed 150,000 new jobs were added in October, below the 180,000 expected.
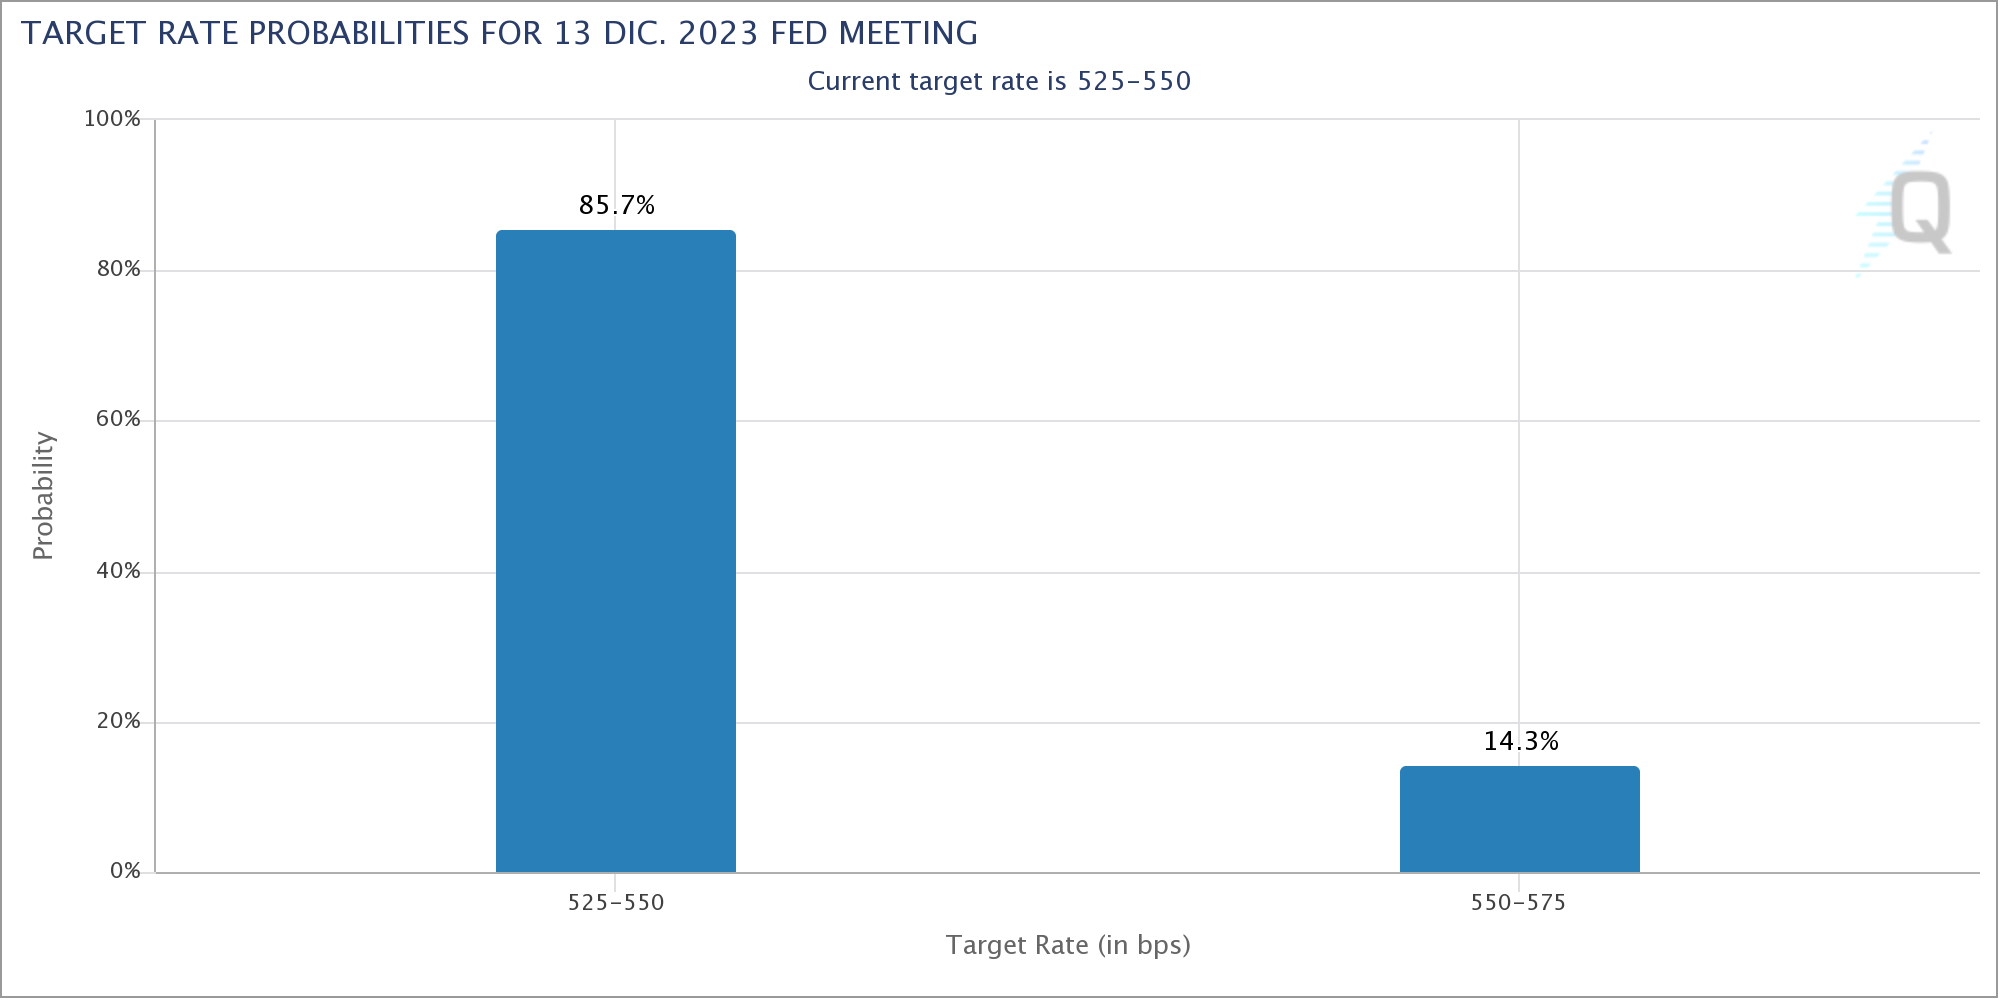
The Federal Reserve’s decision and the slowdown in employment growth resulting from the publication of October non-farm payrolls unleashed euphoria in an equity market, and expectations of a rate hike in December remain low.
Since then, and in the absence of top-level economic publications in the US, investors’ attention focused on the speeches of different Fed members during the week, which offered some contradictory messages.
Just as markets were beginning to prepare for the end of the US Federal Reserve’s rate hike cycle, Chairman Jerome Powell said in a speech last week that more hikes could still come as the Fed sees a possible rebound in inflationary pressures. This reasoning was confirmed on Friday, when preliminary November figures from the University of Michigan revealed an uptick in inflation expectations.
Jerome Powell and his colleagues conveyed that their work to control inflation is not over yet. Powell said he was less confident that current interest rate policy would be restrictive enough to keep inflation under control, leaving the door open to further rate hikes in the near-term future. Additionally, Powell warned that a failure to control inflation would be the central bank’s biggest mistake.
Although Fed officials are leaning toward a further hike in interest rates, investors still do not see a rate hike in December. At the time of writing, the CME’s FedWatch Tool shows a less than 15% chance of another rate hike at the Fed’s December meeting.
Meanwhile, a University of Michigan (UM) survey revealed that Consumer Sentiment deteriorated 3.4 points in the preliminary reading for November, standing at 60.4 compared to 63.8 in October, its lowest level in six months, while American households revised upward their inflation expectations one year from now, placing them at 4.4%, while for five years they placed them at 3.2%.
This week, markets’ attention will be focused on the US Consumer Price Index (CPI) data for October due to be released on Tuesday. US consumer inflation is expected to provide clues to the Federal Reserve’s monetary policy action at its last meeting of 2023 in December. For October inflation data, headline inflation is expected to grow 0.1% monthly, compared to the 0.4% growth recorded in September. Core CPI data is expected to grow at a steady 0.3% MoM and 4.1% YoY in October. The persistence of inflation data may increase expectations of a new rate hike by the Fed in December.
Nasdaq 100 technical levels
Source: Fx Street
I am Joshua Winder, a senior-level journalist and editor at World Stock Market. I specialize in covering news related to the stock market and economic trends. With more than 8 years of experience in this field, I have become an expert in financial reporting.


