
- The New Zealand Dollar gains traction in early Asian trading on Monday.
- Fading odds of a RBNZ rate cut and higher Chinese inflation data support the Kiwi.
- The RBNZ monetary policy meeting will be in focus on Wednesday.
The New Zealand Dollar (NZD) is attracting some buyers near the psychological 0.6000 level on Monday. The Kiwi is gaining traction as markets reduced bets on a rate cut by the Reserve Bank of New Zealand (RBNZ) at its August meeting on Wednesday, following the stronger-than-expected jobs report. Moreover, China’s higher-than-expected July Consumer Price Index (CPI) is supporting the China proxy NZD as China is New Zealand’s largest trading partner.
However, high volatility and elevated geopolitical risks in the Middle East could exert some selling pressure on riskier assets like the Kiwi and limit the pair’s upside. Traders are looking to the RBNZ rate decision on Wednesday for fresh catalysts. On the US docket, the Producer Price Index (PPI), Consumer Price Index (CPI) and Retail Sales will be released on Tuesday, Wednesday and Thursday respectively.
Daily Market Wrap: New Zealand Dollar trades stronger as traders reduce bets on RBNZ rate cut
- Twelve of 21 economists surveyed by Bloomberg expect New Zealand’s central bank to hold the OCR at 5.5% on Wednesday.
- The NZIER Shadow Council is divided on whether the Reserve Bank of New Zealand (RBNZ) should lower the official cash rate (OCR) in its upcoming Monetary Policy Statement in August.
- More than half of the Shadow Council members expect a 25 basis point reduction in the OCR due to the continued weakness of the New Zealand economy. The other members suggested that the Reserve Bank should keep the OCR at 5.50%.
- China’s CPI rose 0.5% year-on-year in July, compared with a 0.2% increase in June, higher than expectations for a 0.3% rise, China’s National Bureau of Statistics reported on Friday. On a monthly basis, Chinese CPI inflation came in at 0.5% month-on-month in July versus -0.2% previously, above the consensus of 0.3%.
- Fed Governor Michelle Bowman said on Sunday she still sees upside risks to inflation and continued strength in the labor market, noting that the Fed may not be ready to cut rates at its next meeting in September, according to Reuters.
- Traders have priced in a nearly 52.5% chance that the Fed will cut rates by 50 basis points (bps) at its September meeting, up from 57.5% last week, according to the CME FedWatch tool.
Technical analysis: New Zealand dollar remains bearish in the long term
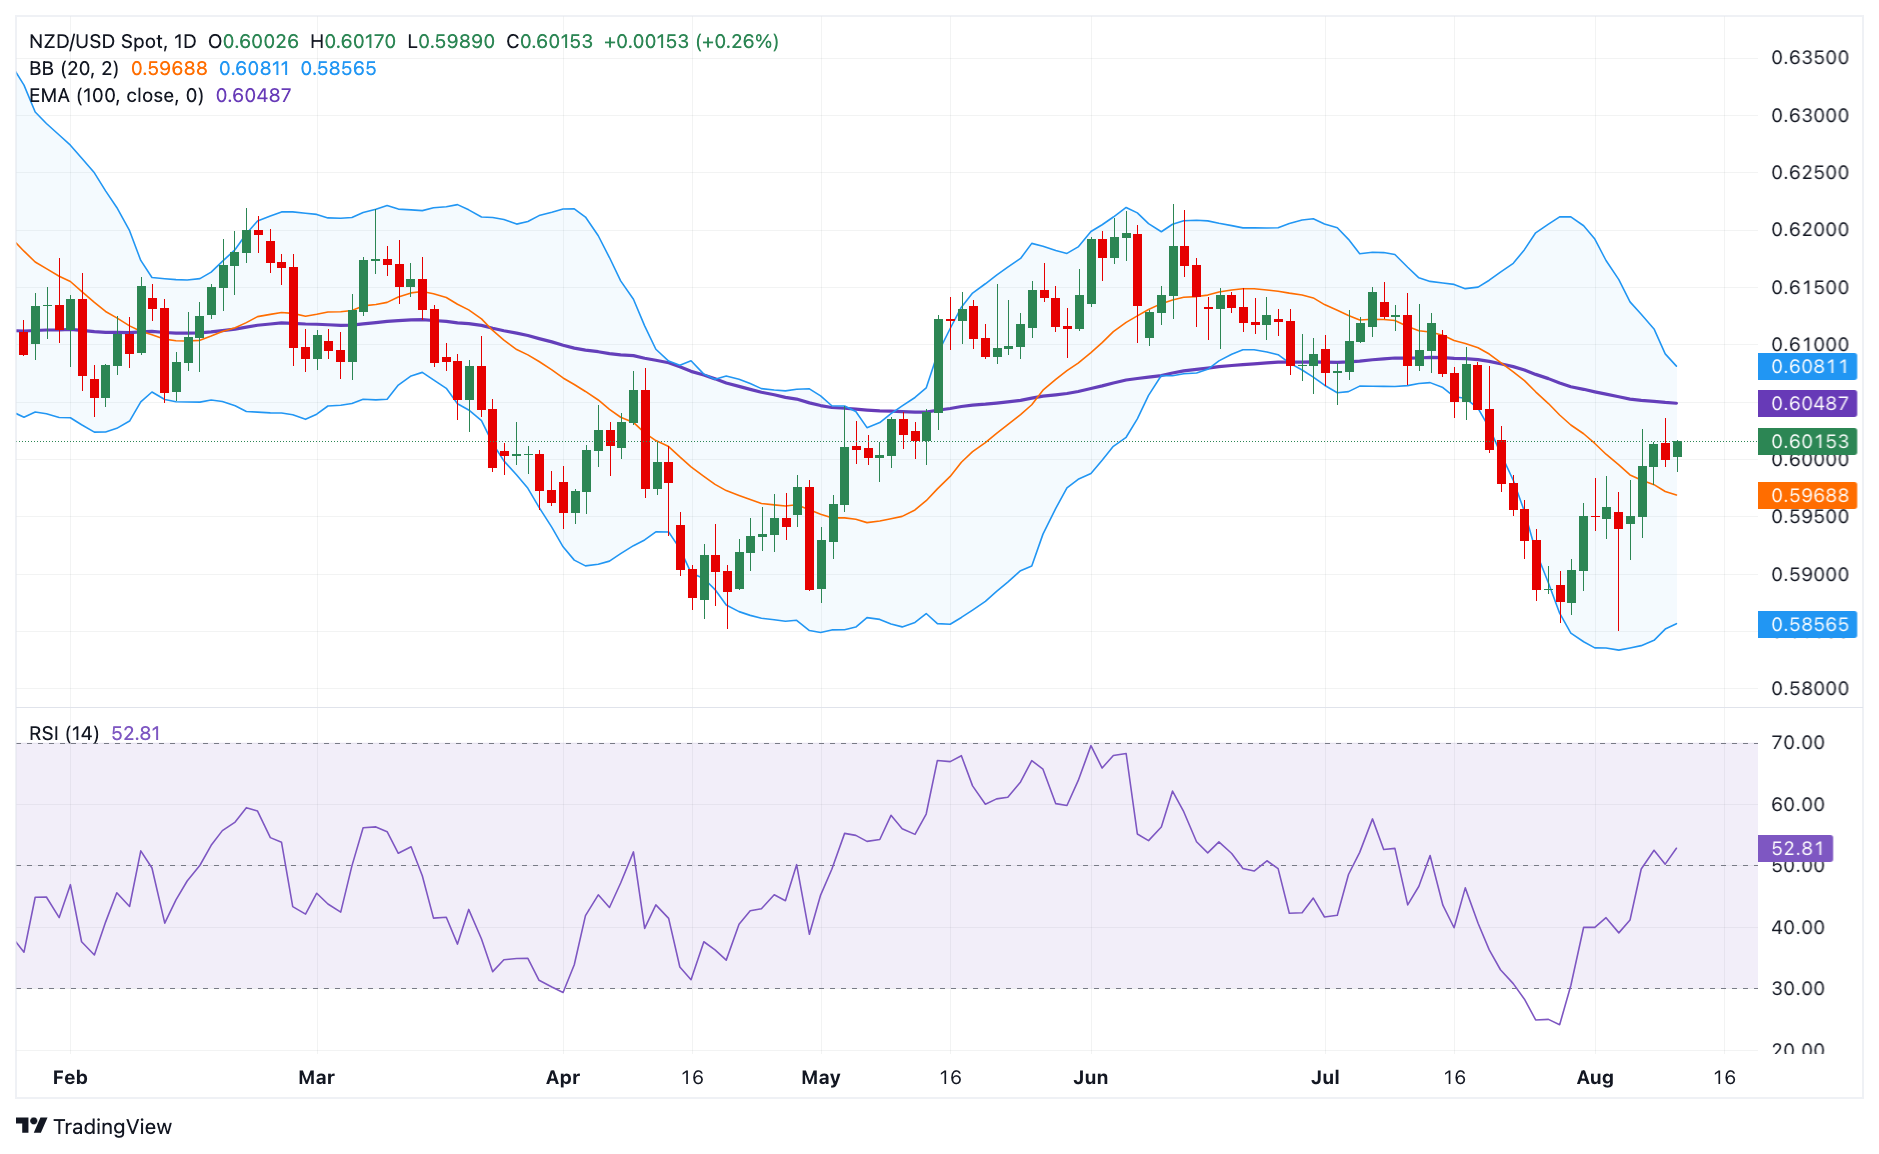
The New Zealand Dollar is up on the day. However, the NZD/USD pair maintains the bearish vibe on the daily time frame, characterized by the price holding below the key 100-day exponential moving average (EMA). The 14-day Relative Strength Index (RSI) is in neutral territory, hovering around the mid-line of 50. This suggests that the price might face consolidation before making a decisive move.
In the bullish scenario, the 100-period EMA near 0.6050 acts as an immediate resistance level for NZD/USD. Further north, this could pave the way for a move towards 0.6080, the upper boundary of the Bollinger Band. The additional upside filter to watch is 0.6134, a high from July 9.
If sellers regain control, we could see a pullback towards 0.5912, a low of August 6. Sustained trading below the mentioned level could drag the pair to 0.5856, a low of July 29 and the lower boundary of the Bollinger Band.
US Dollar Price Today
The table below shows the percentage change of the US Dollar (USD) against the major currencies listed today. The US Dollar was the weakest against the New Zealand Dollar.
| USD | EUR | GBP | CAD | AUD | JPY | NZD | CHF | |
| USD | -0.08% | -0.09% | -0.05% | -0.26% | -0.16% | -0.34% | -0.04% | |
| EUR | 0.10% | 0.02% | 0.05% | -0.14% | -0.05% | -0.23% | 0.06% | |
| GBP | 0.09% | 0.00% | 0.04% | -0.17% | -0.07% | -0.25% | 0.03% | |
| CAD | 0.06% | -0.03% | -0.02% | -0.19% | -0.10% | -0.28% | 0.01% | |
| AUD | 0.26% | 0.16% | 0.16% | 0.18% | 0.08% | -0.10% | 0.19% | |
| JPY | 0.17% | 0.07% | 0.06% | 0.09% | -0.10% | -0.18% | 0.11% | |
| NZD | 0.33% | 0.24% | 0.24% | 0.28% | 0.08% | 0.16% | 0.28% | |
| CHF | 0.06% | -0.02% | -0.02% | 0.01% | -0.19% | -0.10% | -0.28% |
The heatmap shows the percentage changes of the major currencies relative to each other. The base currency is chosen from the left column, while the quote currency is chosen from the top row. For example, if you choose the Euro from the left column and move along the horizontal line to the Japanese Yen, the percentage change shown in the chart will represent EUR (base)/JPY (quote).
Source: Fx Street
I am Joshua Winder, a senior-level journalist and editor at World Stock Market. I specialize in covering news related to the stock market and economic trends. With more than 8 years of experience in this field, I have become an expert in financial reporting.


 with a doctorate in literature that taught Harvard")

