
- The NZD/JPY starts Monday's session trading at 91.71 with slight gains.
- On the daily chart, the RSI places NZD/JPY within the negative zone, indicating short-term bullish traction.
- If buyers fail to recapture the 20-day moving average, the outlook could begin to shift in favor of sellers.
In Monday's session, the NZD/JPY pair moves around the 91.71 area, trading with slight gains. The overall market tone for the pair suggests a bearish trend, as sellers remain in control, after closing a week with losses of 1.70% and adding a five-day losing streak. However, there are signs of gradual bullish momentum in the shorter terms.
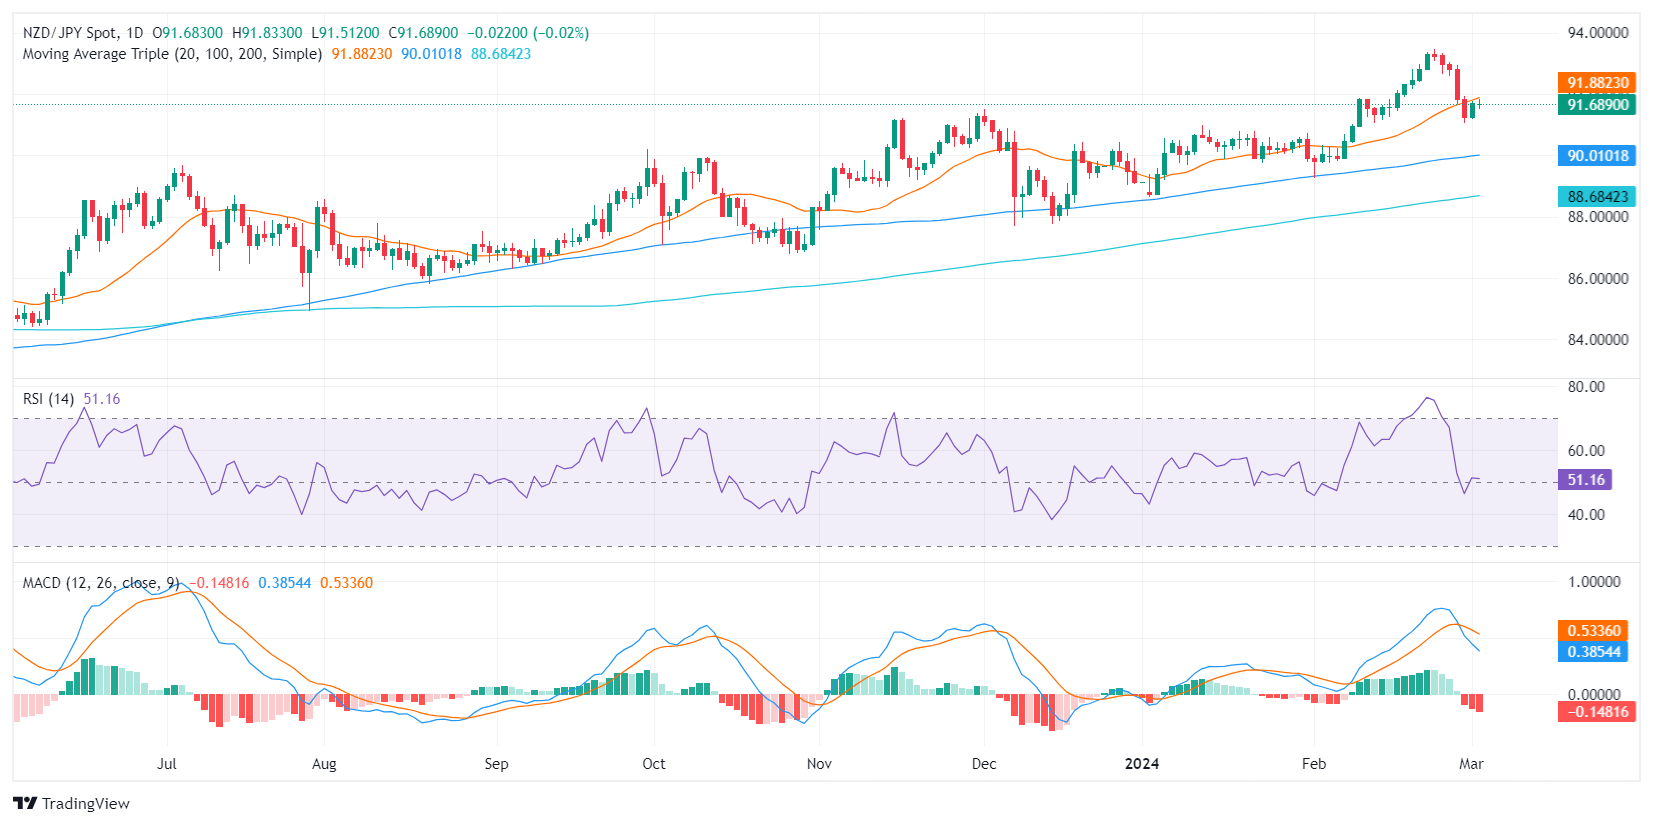
On the daily chart, the Relative Strength Index (RSI) shows the NZD/JPY pair in negative territory, indicating short-term bearish momentum as sellers control the market after reaching overbought conditions last week. The rising red bars on the moving average convergence divergence (MACD) histogram signal that negative momentum is on the rise.
NZD/JPY daily chart
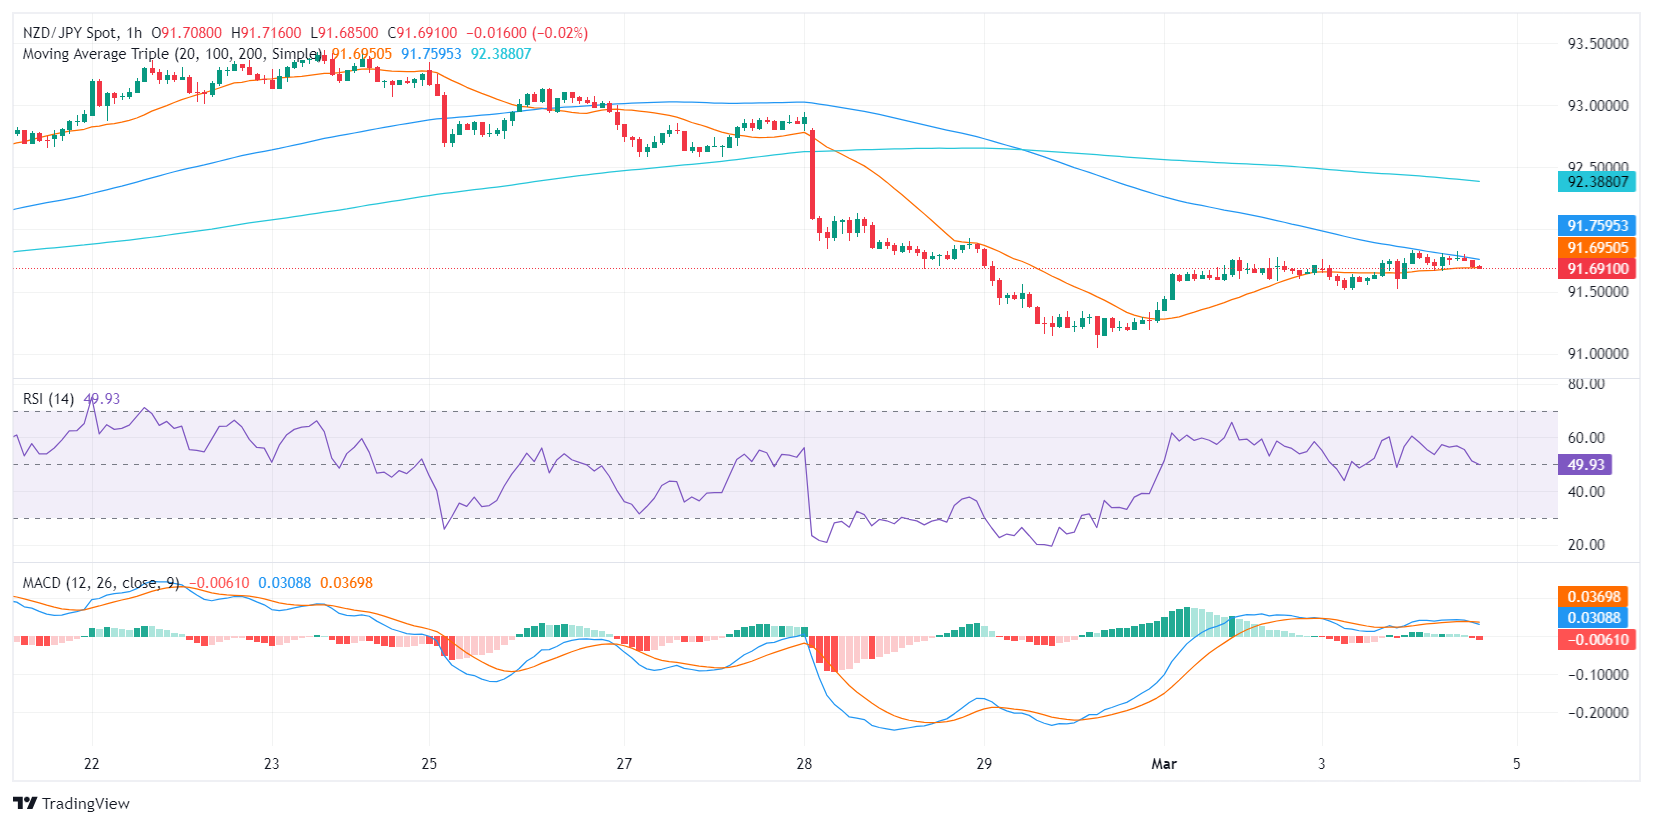
Meanwhile, on the hourly chart, the RSI is fluctuating within the positive territory, suggesting bullish momentum. However, the MACD histogram on this chart also features ascending red bars, suggesting continued negative momentum.
NZD/JPY hourly chart
In conclusion, while investors are showing a short-term bearish tilt on the daily chart, the patterns on the hourly chart suggest that bulls are putting up a fight. That said, the pair is holding the 100- and 200-day simple moving averages (SMA), which tend to suggest an overall bullish trend. However, as long as buyers fail to conquer the 20-day moving average, the short-term bias will remain negative.
Source: Fx Street
I am Joshua Winder, a senior-level journalist and editor at World Stock Market. I specialize in covering news related to the stock market and economic trends. With more than 8 years of experience in this field, I have become an expert in financial reporting.


