
- The NZD/JPY pair trimmed daily gains and is trading at a loss in the American session.
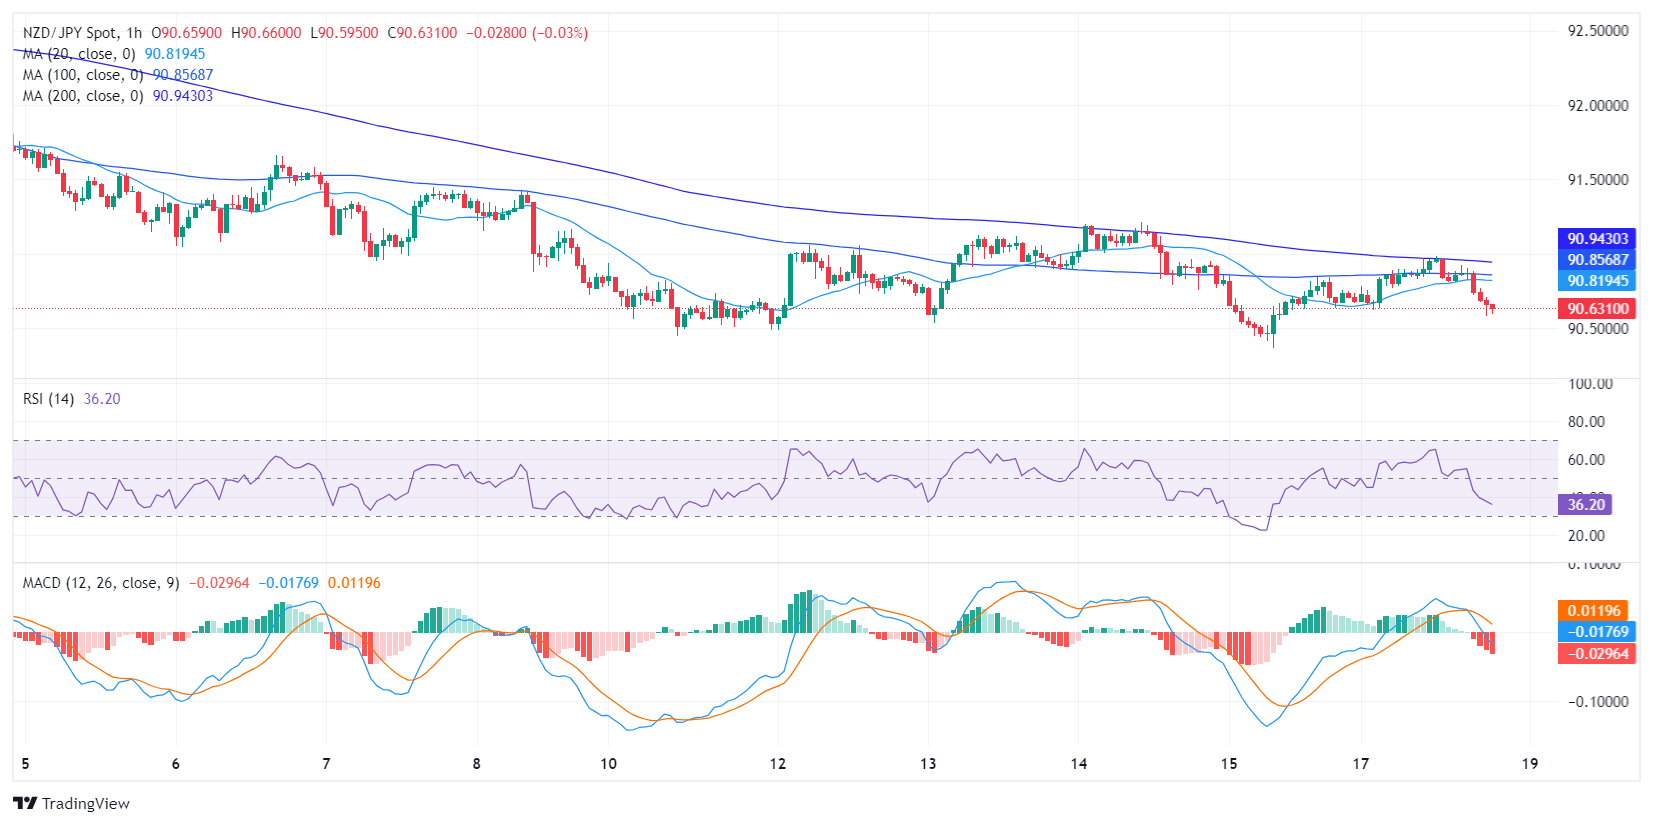
- On the hourly chart, the indicators are moving towards oversold territory.
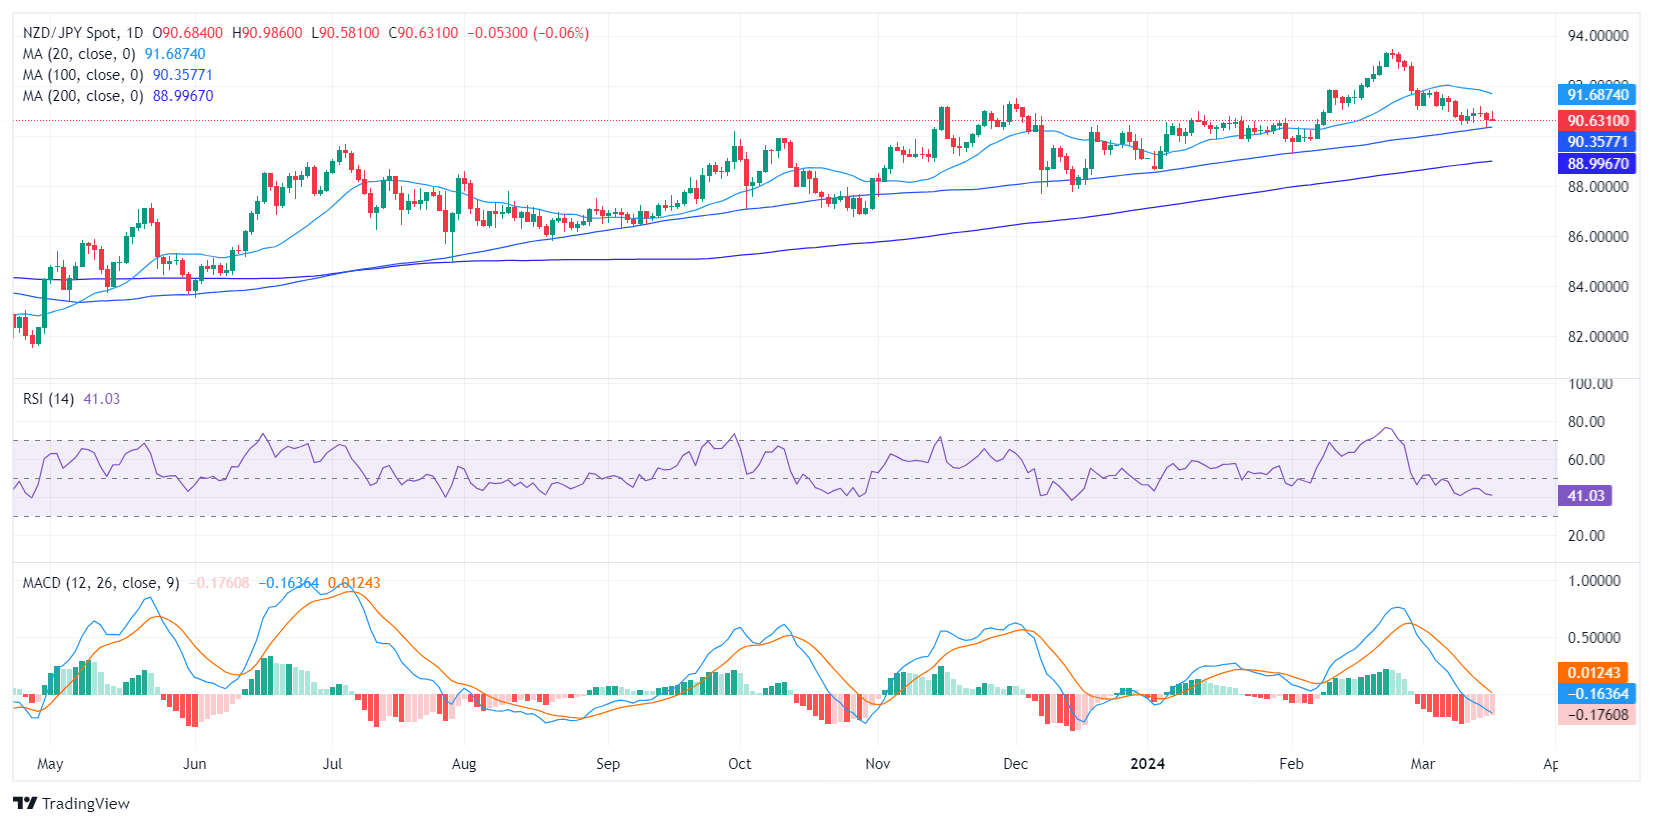
- On the daily chart, the indicators remain mostly flat.
In Monday's session, the NZD/JPY pair reversed course and gave up daily gains to fall towards 90.60. The latest moves show an intensification of selling activity, as the indicators slowly move towards oversold territory, while on the daily chart the selling traction flattens out a bit.
On the daily chart, the Relative Strength Index (RSI) fell into negative territory last week and currently sits around 40.65, mostly flat. This reveals lower momentum from sellers. This trend is exalted by the flat red Moving Average Convergence Divergence (MACD) bars, which suggest that negative momentum is consolidating.
NZD/JPY daily chart
On the hourly chart, the RSI fell into negative territory, while the MACD showed ascending red bars. However, as short-term indicators appear to be moving towards oversold territory, it could pave the way for a short-term rally to consolidate losses.
NZD/JPY hourly chart
In conclusion, while the indicators appear to have turned flat on the daily chart, the selling momentum intensified on the hourly chart, suggesting that the pair could suffer further for the remainder of the session. Looking at the general trend, there are not enough arguments to conclude a bearish outlook, as the pair is above the 100- and 200-day SMA. That said, sellers are in control in the short term.
Source: Fx Street
I am Joshua Winder, a senior-level journalist and editor at World Stock Market. I specialize in covering news related to the stock market and economic trends. With more than 8 years of experience in this field, I have become an expert in financial reporting.


