
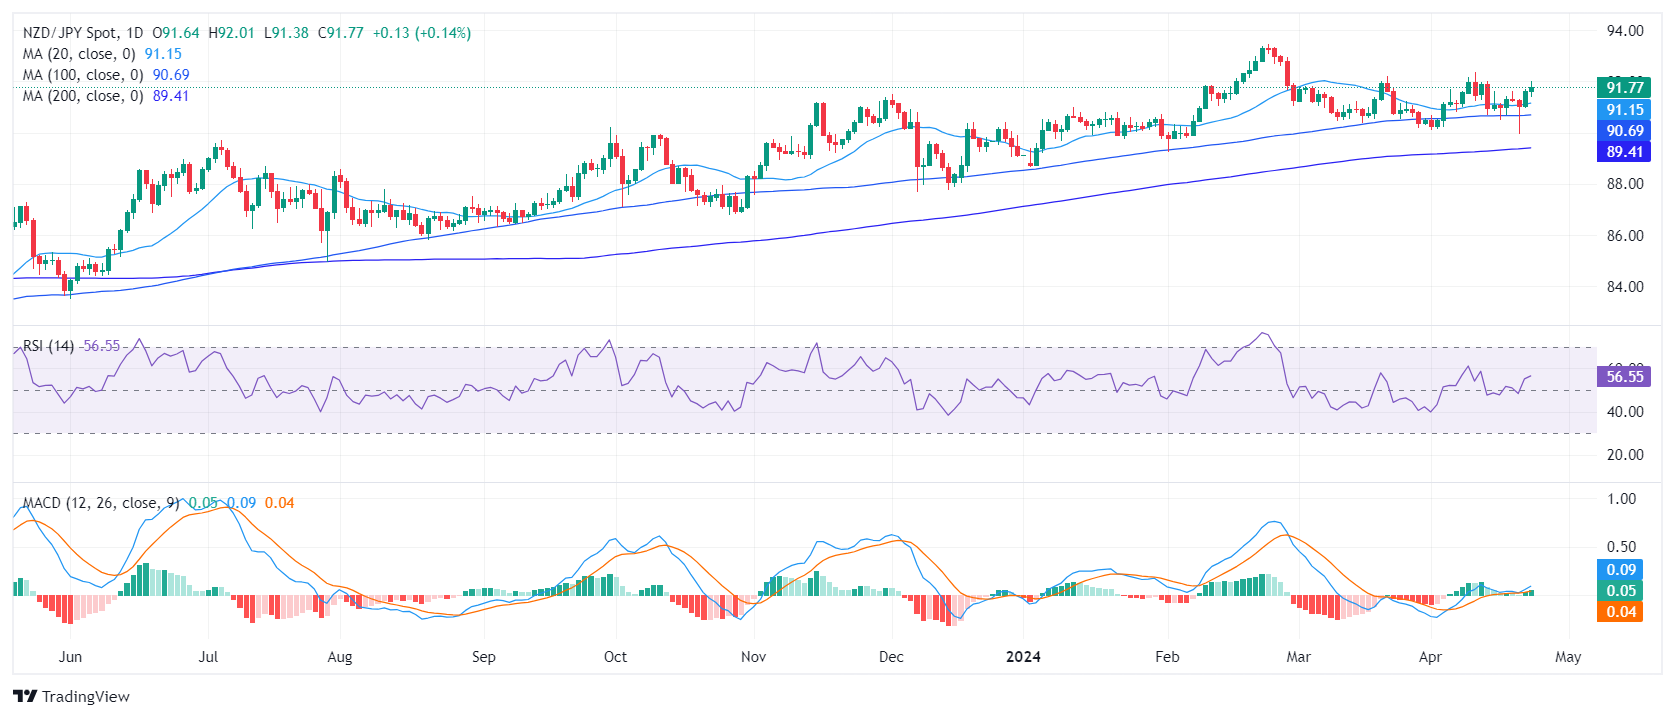
- The NZD/JPY daily chart shows the continuation of the bullish momentum, with the indicators in positive territory.
- Hourly indicators are correcting overbought conditions.
The NZD/JPY pair recorded daily gains during the session on Tuesday and reached 91.78. The pair remains solid above the main simple moving averages (SMA), which could be a sign of additional strength despite the intraday pullbacks seen during the American session. Indicators remain strong on the daily chart, but hourly charts are losing traction as they correct overbought conditions.
On the daily chart, the RSI for NZD/JPY shows a positive trend within the positive territory. The moving average divergence (MACD) histogram also shows rising green bars, indicating bullish momentum.
NZD/JPY daily chart
On the hourly chart, the RSI shows a reading of 68, but is pointing south, revealing that buyers appear to be taking a breather, having reached overbought conditions earlier in the session. The hourly MACD, similar to the daily chart, also shows green bars, suggesting a bullish trajectory.
NZD/JPY hourly chart
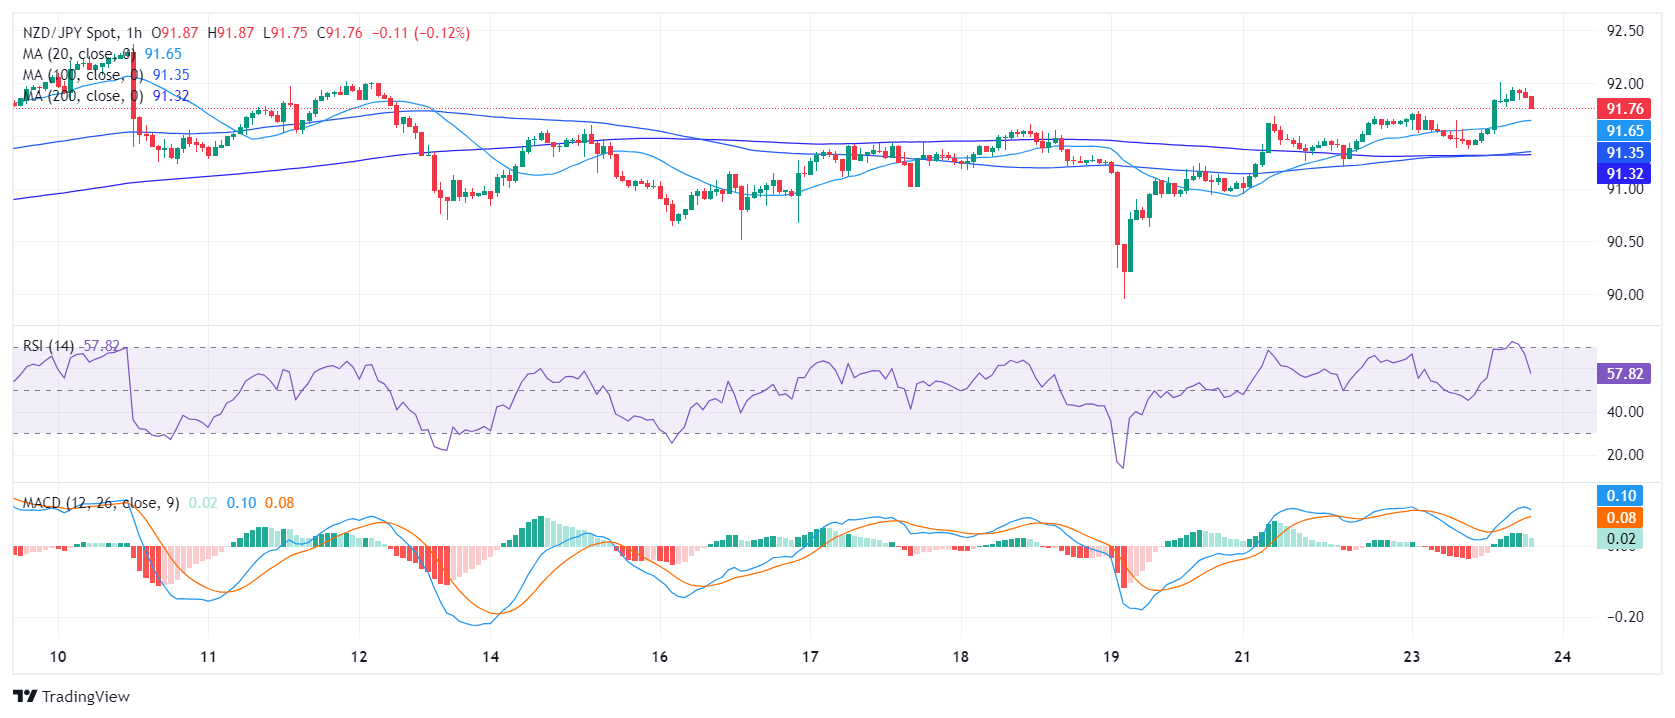
Looking at the bigger picture, NZD/JPY remains favorably positioned above its relevant simple moving averages (SMAs), which are the 20, 100 and 200 day time horizons. However, before the Asian session the pair could suffer further setbacks, as indicators begin to lose traction on the hourly chart. On the other hand, the daily RSI and MACD remain strong and unless the bears conquer the 20-day SMA, the outlook will remain positive.
Source: Fx Street
I am Joshua Winder, a senior-level journalist and editor at World Stock Market. I specialize in covering news related to the stock market and economic trends. With more than 8 years of experience in this field, I have become an expert in financial reporting.


