
- The NZD/JPY pair is currently trading at 91.63, posting gains of 0.32% in Wednesday's session.
- The daily chart shows consistent bullish sentiment, with the RSI and MACD affirming positive momentum.
- Hourly indicators also show a dominant bullish bias.
In Wednesday's session, the pair NZD/JPY It stood at 91.63, reflecting a rise of 0.32%, as the bears seem to have run out of steam after two sessions of losses.
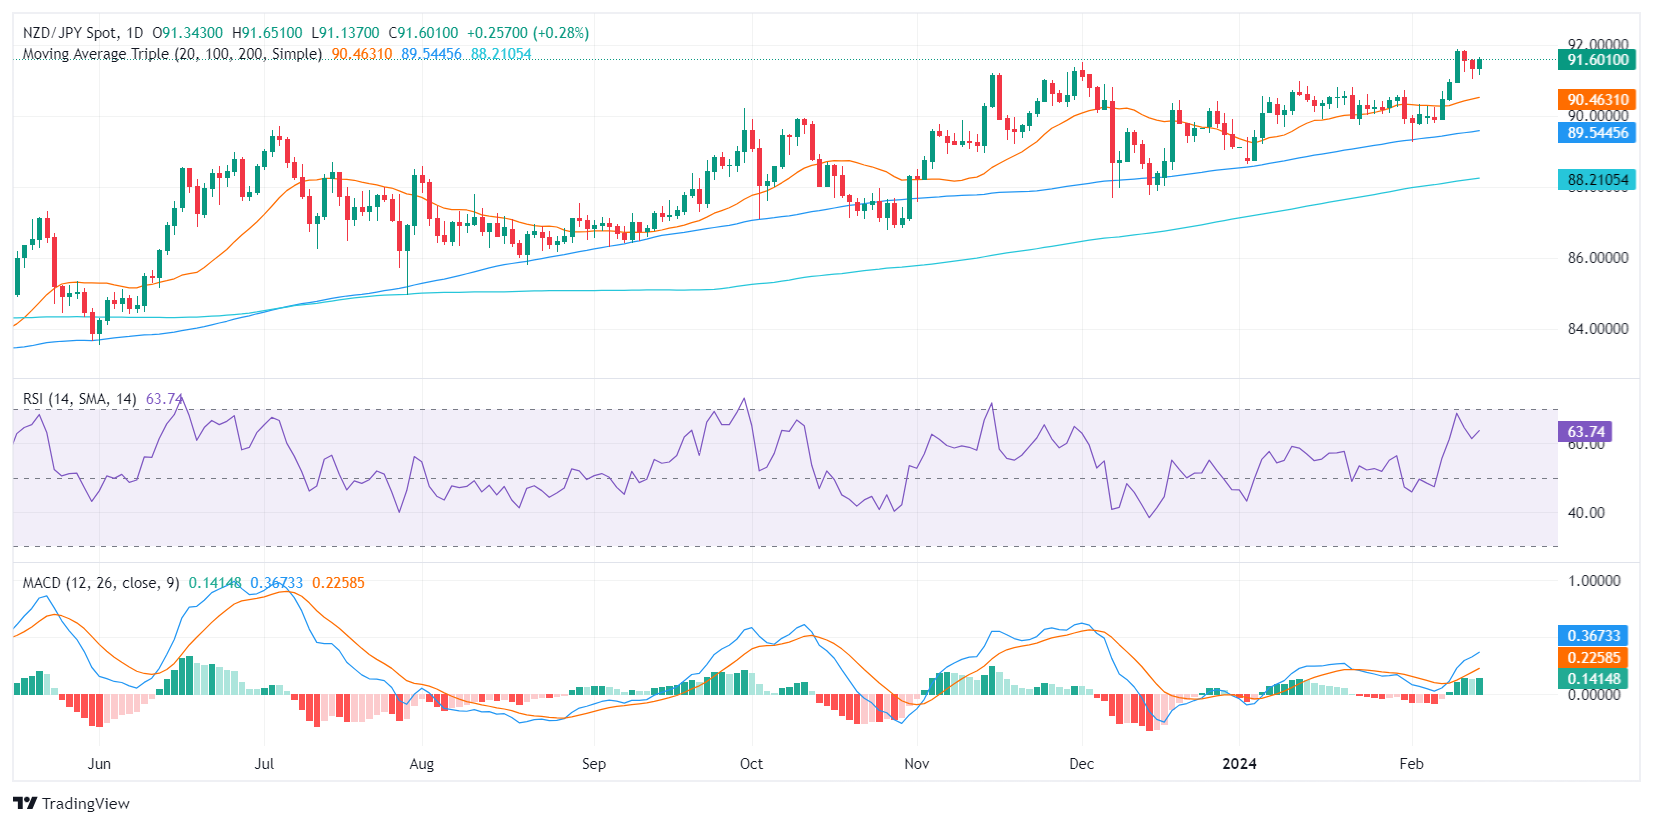
Starting with the daily chart analysis, the Relative Strength Index (RSI) suggests sustained positive sentiment as it is consistently within the bullish territory, without entering the overbought space. Simultaneously, the MACD histogram prints green bars and shows an uptrend, reinforcing the positive momentum represented by the RSI. Furthermore, the cross maintains its positioning above the 20,100,200-day SMA, a sign of continued control by the bulls on broad time frames.
NZD/JPY daily chart
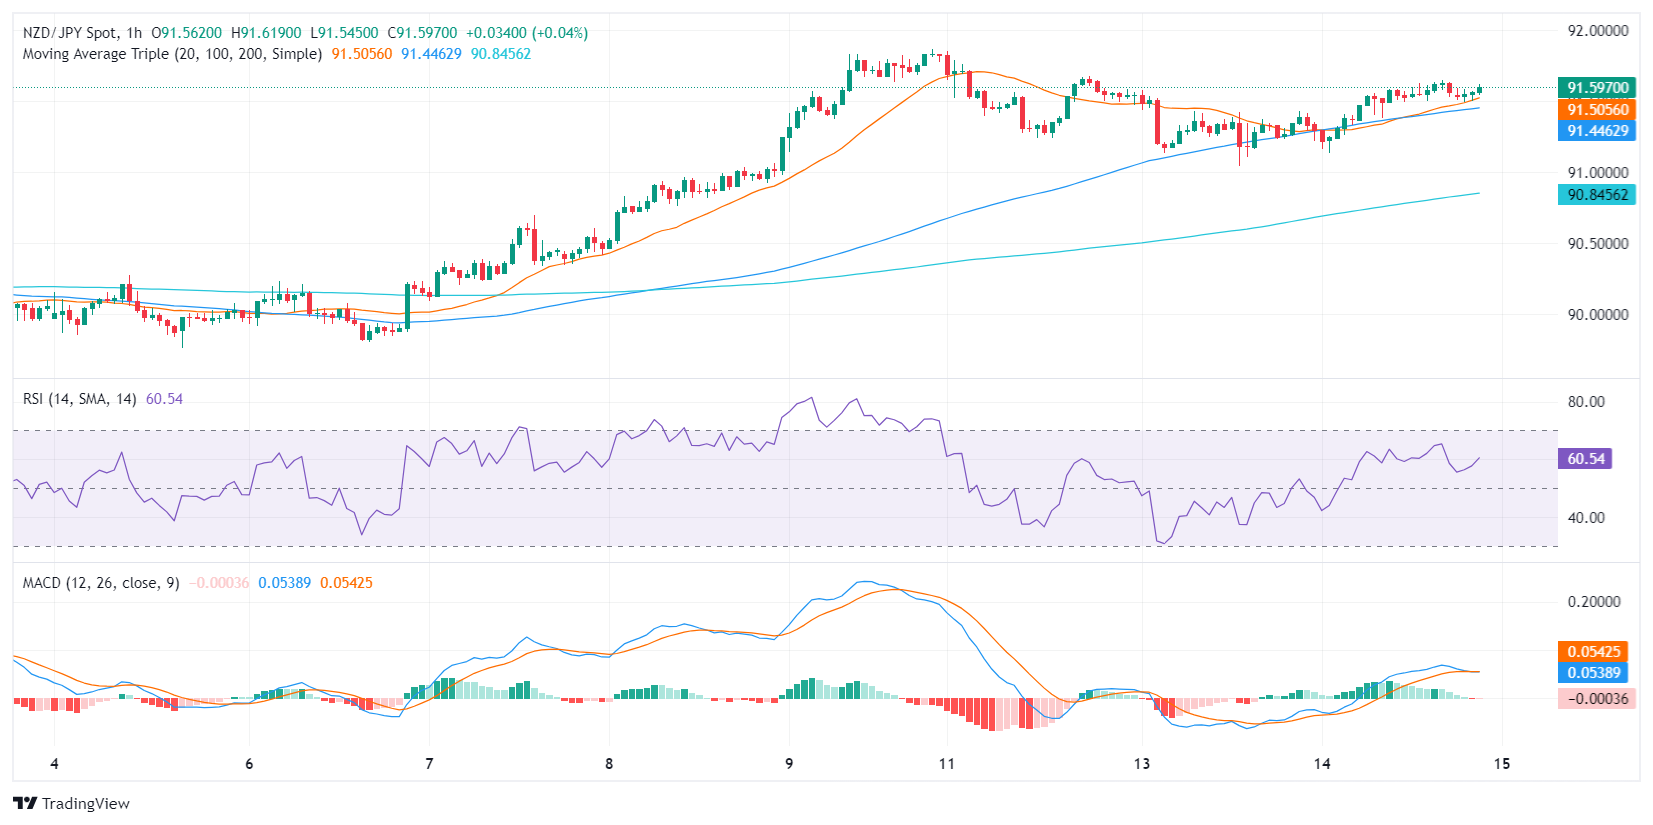
Moving on to the hourly analysis, the RSI readings are fluctuating around the positive zone, while the MACD histogram continues to print green bars, but appears to be flattening and falling into the negative territory. This aligns with the picture painted by the daily indicators, further solidifying the perception of a dominant bullish bias, but the MACD leaves the door open for further declines.
NZD/JPY hourly chart
Source: Fx Street
I am Joshua Winder, a senior-level journalist and editor at World Stock Market. I specialize in covering news related to the stock market and economic trends. With more than 8 years of experience in this field, I have become an expert in financial reporting.


