
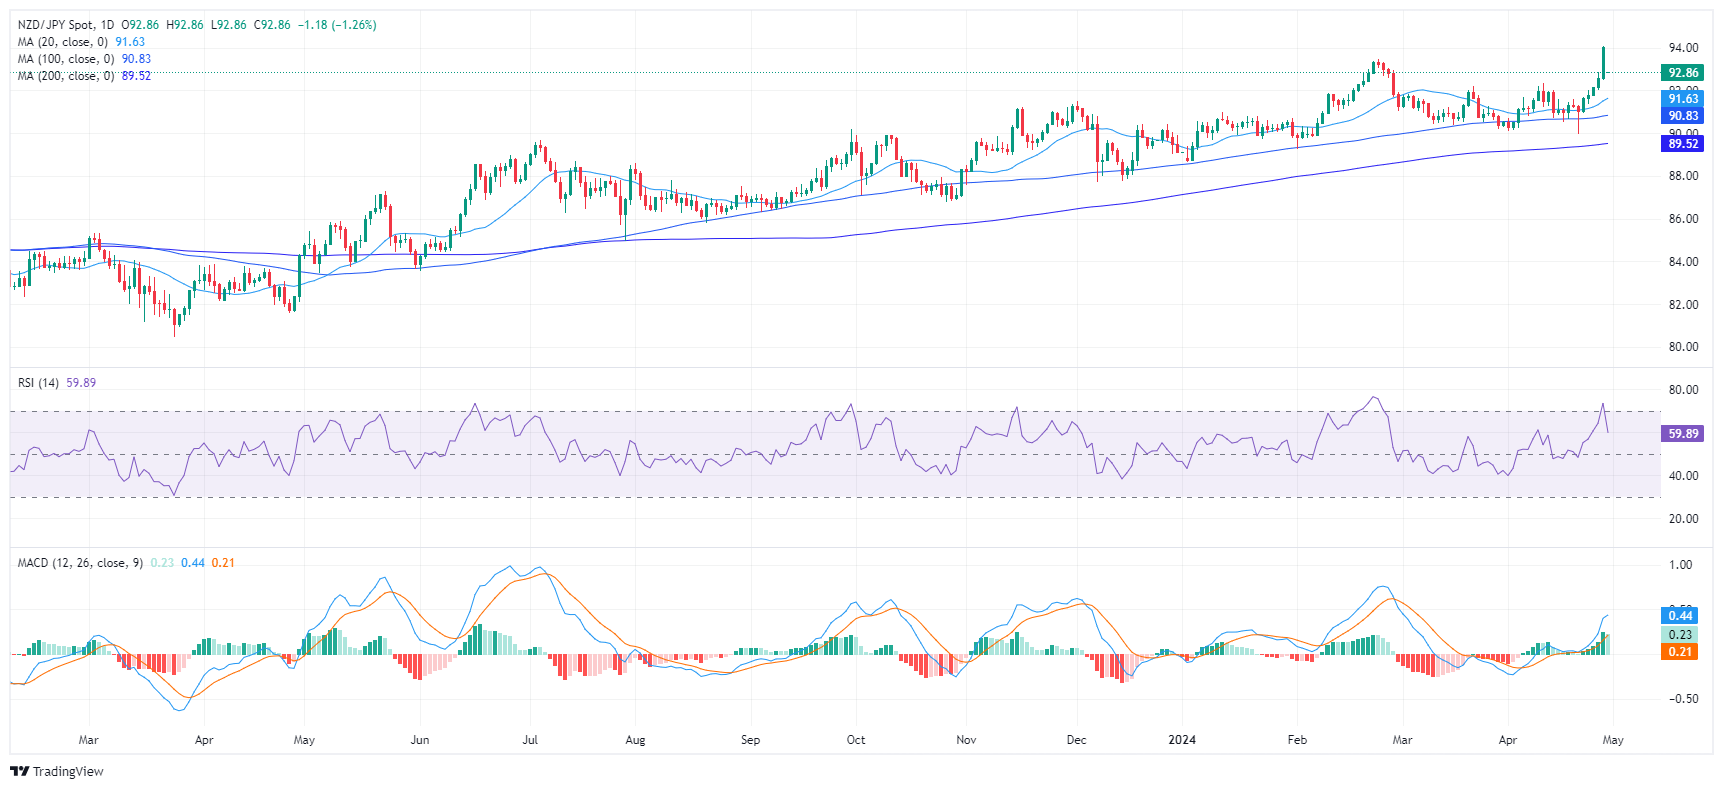
- The daily RSI for NZD/JPY is showing a decreasing trend, hinting at a growing bearish bias.
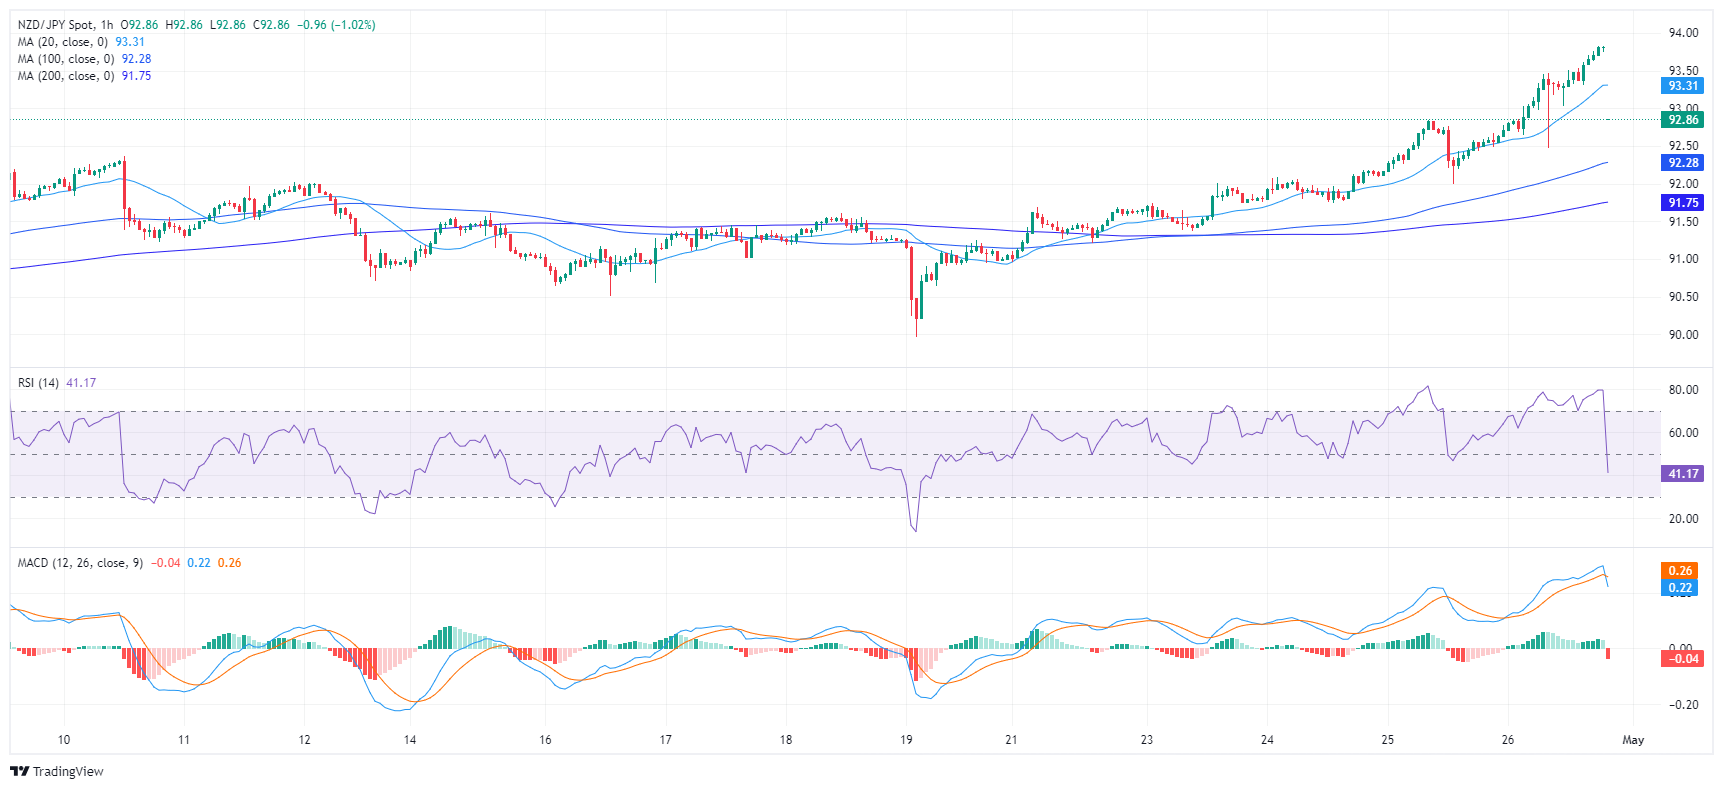
- On the hourly chart, both the RSI and MACD reflect a growing bearish trend, supporting the sentiment on the daily chart.
- Any move that leaves the pair above its 20-day SMA will not challenge the bullish outlook.
The NZD/JPY pair fell 0.45% on Tuesday and is trading at 92.99. Despite some bearish overtones, NZD/JPY maintains a long-term bullish trend above its main SMAs. There is potential for short-term momentum swings as investors are pulling back to take profits after driving the pair to highs since 2015 on Monday.
On the daily chart, the RSI for NZD/JPY has decreased over the previous sessions. The index moved from overbought territory to below 70, indicating a possible reversal or slowdown in buying traction.
NZD/JPY daily chart
Moving to an intraday basis, the hourly chart presents a similar scenario. The RSI fell into negative territory. Simultaneously, the Moving Average Convergence Divergence (MACD) printed a red bar indicating bullish negative momentum. This indicates that investors continued to take profits on Tuesday and that sellers dominated trading during the session.
NZD/JPY hourly chart
From a broader perspective, NZD/JPY remains bullish despite the declines as it remains above its 20,100 and 200-day simple moving averages (SMA). However, if the bears manage to gain additional momentum they could reclaim the 20-day SMA, which could worsen the pair's prospects if lost.
Source: Fx Street
I am Joshua Winder, a senior-level journalist and editor at World Stock Market. I specialize in covering news related to the stock market and economic trends. With more than 8 years of experience in this field, I have become an expert in financial reporting.


