
- NZD/JPY is trading range bound, capped by 90.10 and 91.60.
- The RSI is rising slightly into positive territory, the MACD is declining but still positive.
- There is a lack of clear direction, but a possible breakout to the upside could occur.
The NZD/JPY pair continues to move sideways on Wednesday, extending last week’s consolidation. The pair is currently trading at 91.00, with gains of 0.30% and a slightly bullish bias. The pair remains trapped within the range defined by the 90.00 support and 91.00 resistance, with indicators showing a lack of clear direction.
Technical indicators provide a mixed picture. The Relative Strength Index (RSI) is at 55, in positive territory, and is sloping slightly upward, indicating that the buying pressure is constant. However, the moving average convergence/divergence (MACD) indicator is green and declining, suggesting that buying pressure is weak.
The overall outlook is slightly bullish due to the pair’s position above the 20-day simple moving averages (SMA). However, caution is advised as the MACD shows signs of weakening that could lead to a bearish leg. The main support level is the 90.00 area (20-day SMA) which if broken could trigger a drop to the 88.00-87.00 range. On the other hand, the main resistance to conquer is the 91.00 area which could drive an increase towards 91.60.
NZD/JPY daily chart
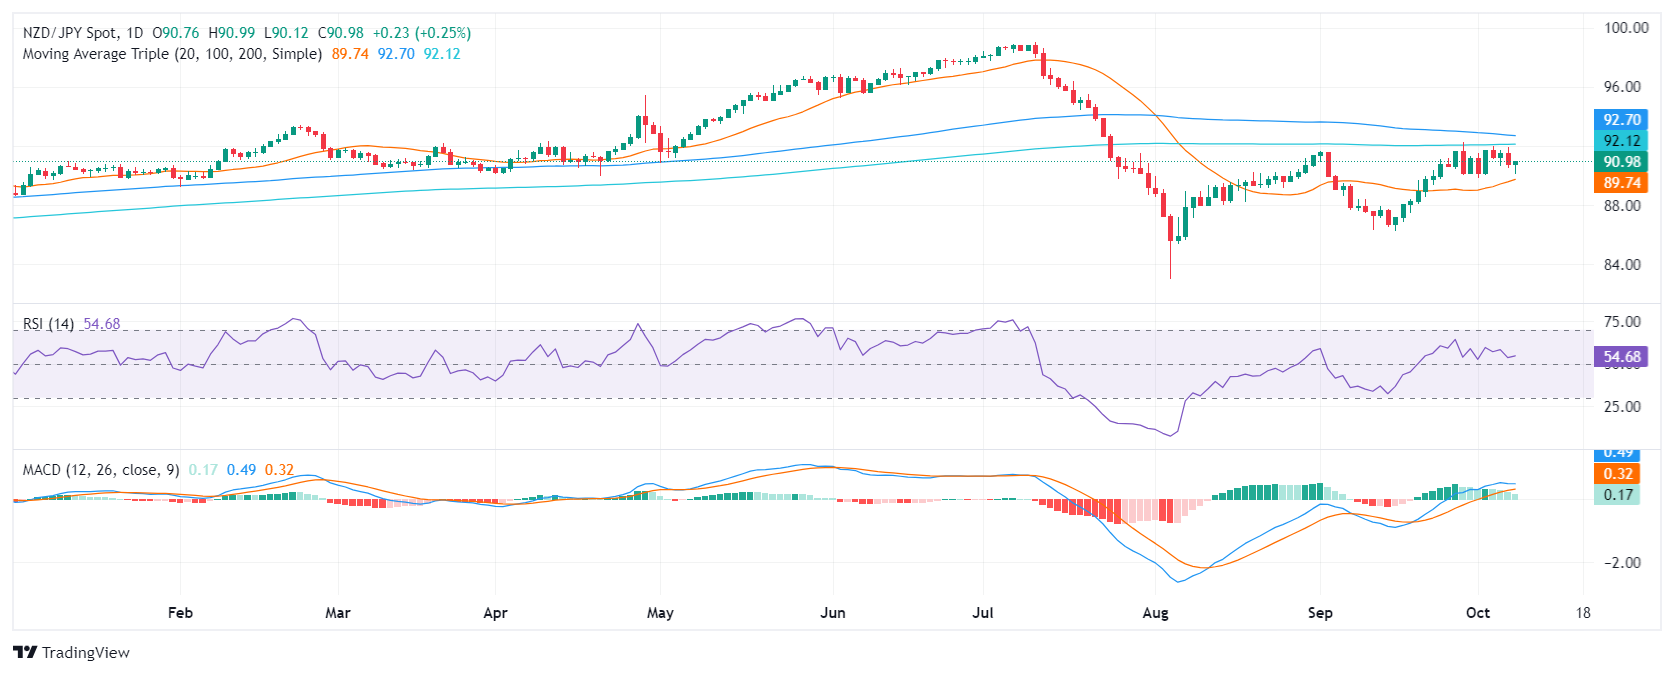
Source: Fx Street
I am Joshua Winder, a senior-level journalist and editor at World Stock Market. I specialize in covering news related to the stock market and economic trends. With more than 8 years of experience in this field, I have become an expert in financial reporting.


