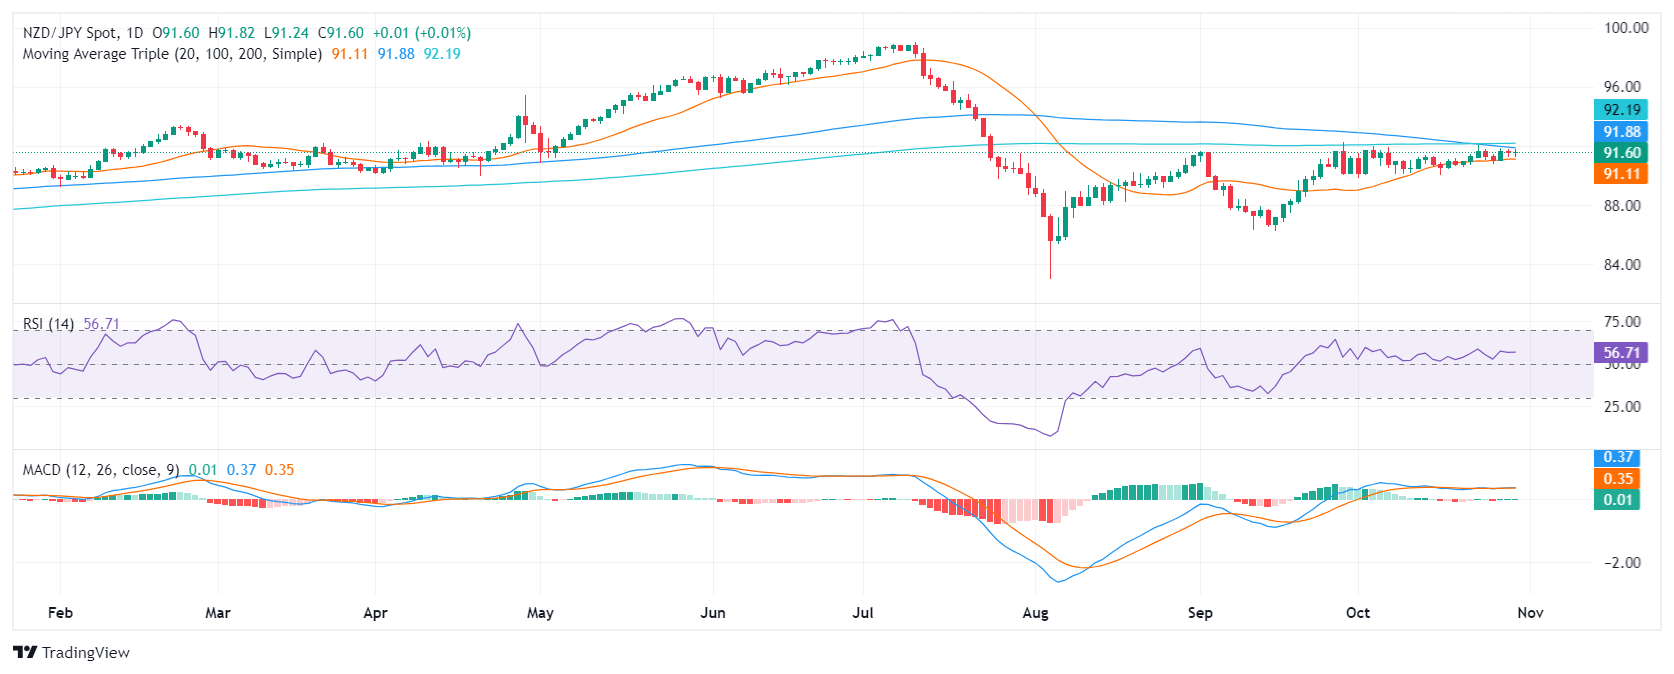
- NZD/JPY faces slight gains, trading at 91.60.
- The near-term outlook remains neutral to bullish, with support at the 20-day SMA temporarily stopping the decline.
- Break above 92.20 needed to confirm uptrend.
In Wednesday’s session, the NZD/JPY pair showed a modest upward movement, reaching 91.60. The overall technical picture suggests a neutral to bullish bias for the near term, due to mixed signals from technical indicators. Additionally, a bearish crossover between the 20-day, 100-day, and 200-day SMA could also change the outlook.
The Relative Strength Index (RSI) currently stands at 58, indicating increasing buying pressure. The Moving Average Convergence/Divergence Indicator (MACD) shows flat green bars, suggesting a neutral stance between buyers and sellers. This confluence of indicators highlights a possible shift in the balance of power, but with some evidence that buying pressure is gaining momentum.
Traders should watch the 91.50 area where the 20-day, 100-day, and 200-day SMAs are about to confirm a bearish crossover that could trigger a sell-off. However, the 20-day SMA has proven to be a strong barrier, so sellers could find it difficult to overcome it.
Supports: 91.60, 91.30 and 91.15
Resistances: 91.80, 92.00, 92.30
NZD/JPY daily chart
Source: Fx Street
I am Joshua Winder, a senior-level journalist and editor at World Stock Market. I specialize in covering news related to the stock market and economic trends. With more than 8 years of experience in this field, I have become an expert in financial reporting.


