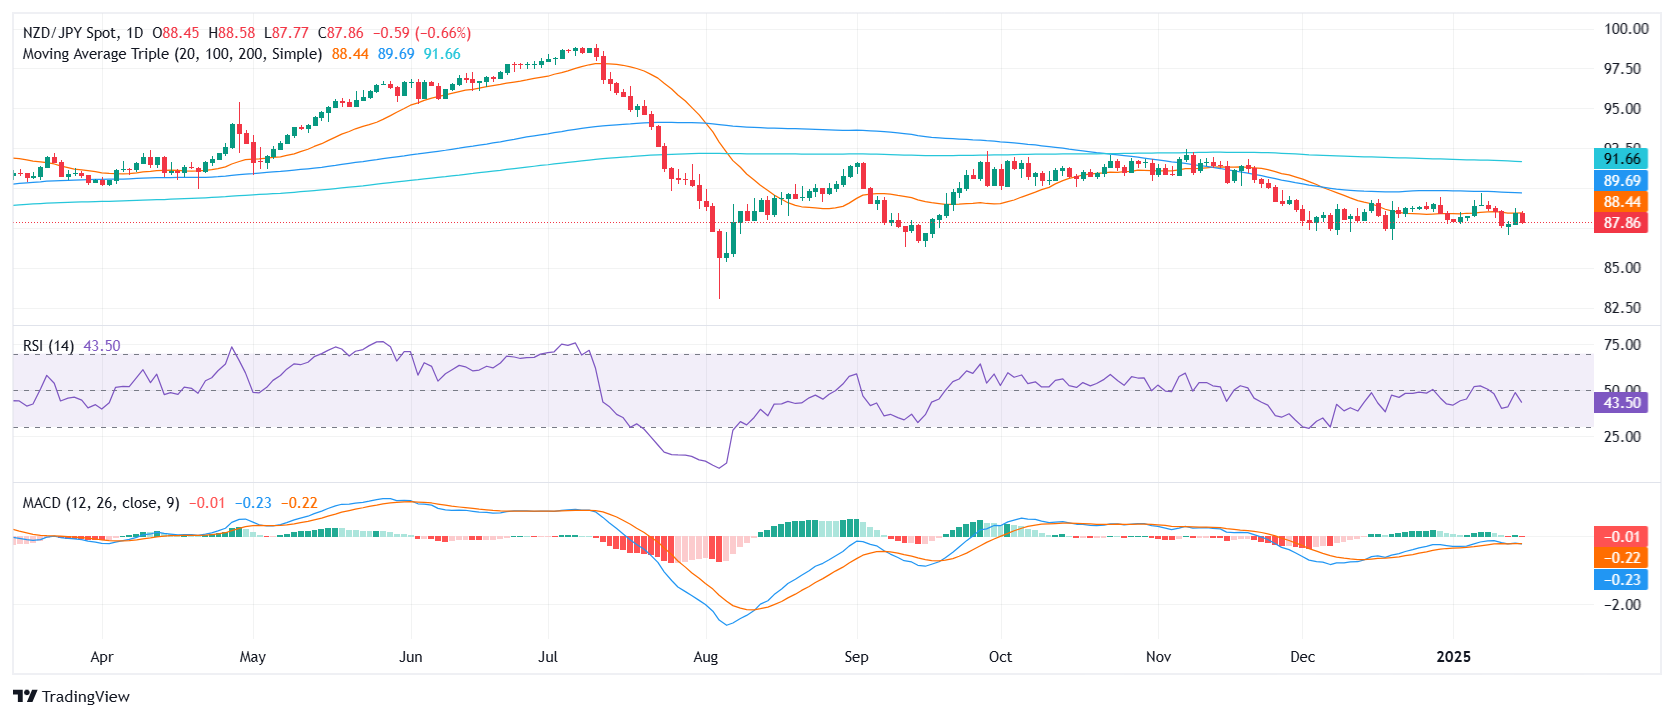
- NZD/JPY landed near 87.80 after the last rejection at 89.00.
- The RSI falls to 44 in negative territory, hinting that the selling forces may be gaining ground.
- The MACD histogram creates flat red bars, underscoring the pair’s fragile recovery attempts.
The NZD/JPY cross entered deeper negative territory on Wednesday, returning 0.77% to settle around 87.80. Sellers took control after another failed attempt to conquer the 20-day Simple Moving Average (SMA) near the 89.00 level. Although the pair initially showed signs of stabilization within the broader 89.00–87.00 channel, persistent selling pressure has prevented it from mounting a convincing bounce.
On the technical front, the Relative Strength Index (RSI) has weakened to 44, reflecting a loss of buying momentum. Similarly, the MACD histogram remains flat and in the red, indicating that the pair’s recovery attempts lack robust follow-through. This combination of weakened indicators and repeated rejections at 89.00 calls into question any near-term upside potential.
As for immediate levels to watch, a drop below 87.50 would put the 87.00 floor under scrutiny, potentially dragging NZD/JPY into deeper territory if the selling intensifies. In contrast, a clean break above 89.00 remains critical to shifting the short-term bias towards bullish territory, although buyers appear reluctant to push the market decisively higher at this time.
NZD/JPY daily chart
Source: Fx Street
I am Joshua Winder, a senior-level journalist and editor at World Stock Market. I specialize in covering news related to the stock market and economic trends. With more than 8 years of experience in this field, I have become an expert in financial reporting.


