
- NZD/JPY fell 0.79% on Monday, trading near 88.05.
- After breaking out of a range last week, the bears pushed NZD/JPY lower towards 88.00.
- Indicators continue to lose ground but are approaching oversold conditions that could trigger a period of consolidation.
NZD/JPY fell 0.79% to 88.05 on Monday, after breaking out of a clear sideways range last week. The Relative Strength Index (RSI) and the Moving Average Convergence/Divergence indicator (MACD) are losing ground and confirming selling pressure, and the outlook is now bearish, at least in the short term.
In that sense, the RSI is in the oversold area, signaling increasing selling pressure, while the MACD also indicates that bearish momentum is increasing. The RSI suggests oversold conditions, which could trigger consolidation, but the continued decline in indicators indicates that the downtrend is likely to persist. In case the cross corrects higher, the bulls could try to reclaim the 89.00 area, and if they are lucky, they could extend a recovery to 90.00. On the downside, selling traction is strong enough to continue pushing the pair towards the 85.00-86.00 range if buyers do not intervene.
NZD/JPY daily chart
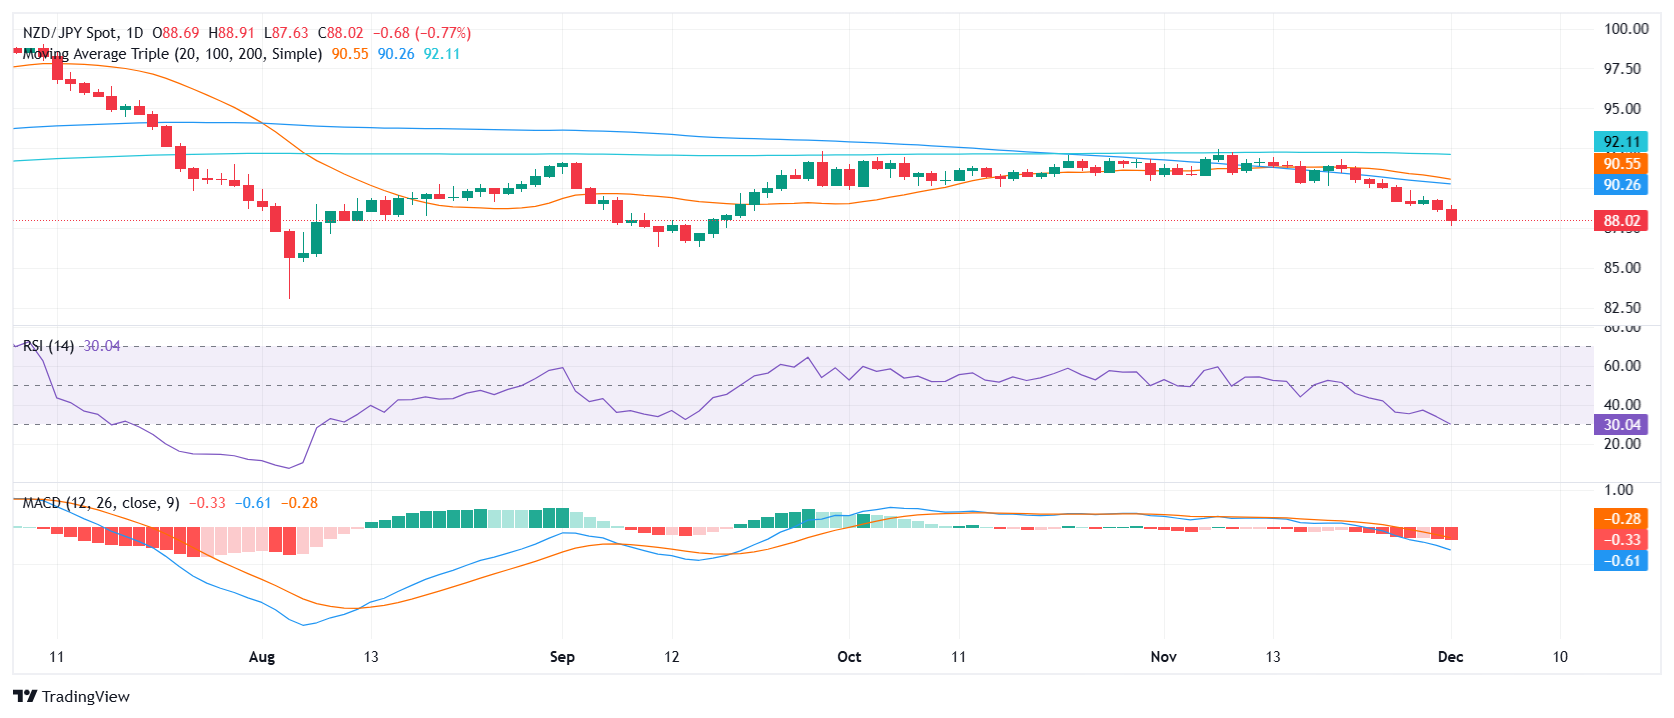
Source: Fx Street
I am Joshua Winder, a senior-level journalist and editor at World Stock Market. I specialize in covering news related to the stock market and economic trends. With more than 8 years of experience in this field, I have become an expert in financial reporting.


