
- NZD/JPY continues its downward spiral, breaking several significant support levels in recent sessions.
- The last hope for the pair is that the RSI remains deeply in oversold territory.
Over the past few trading sessions, the NZD/JPY pair has been moving in a downward trajectory, now around the 89.00 level. The pair has consistently posted losses, further highlighting the ongoing bearish momentum. Over the past few weeks, the cross has seen a drop of over 7%, further falling below the crucial 200-day simple moving average (SMA).
As the pair continues its steady decline, daily technical indicators hint at oversold conditions. These conditions indicate a potential for an upcoming period of stable trading, despite the ongoing decline. The Relative Strength Index (RSI) has been residing in the oversold area, which could trigger an upward correction to counter the selling pressure. Simultaneously, the MACD indicator continues to feature flat red bars, suggesting a pause in the selling onslaught.
NZD/JPY daily chart
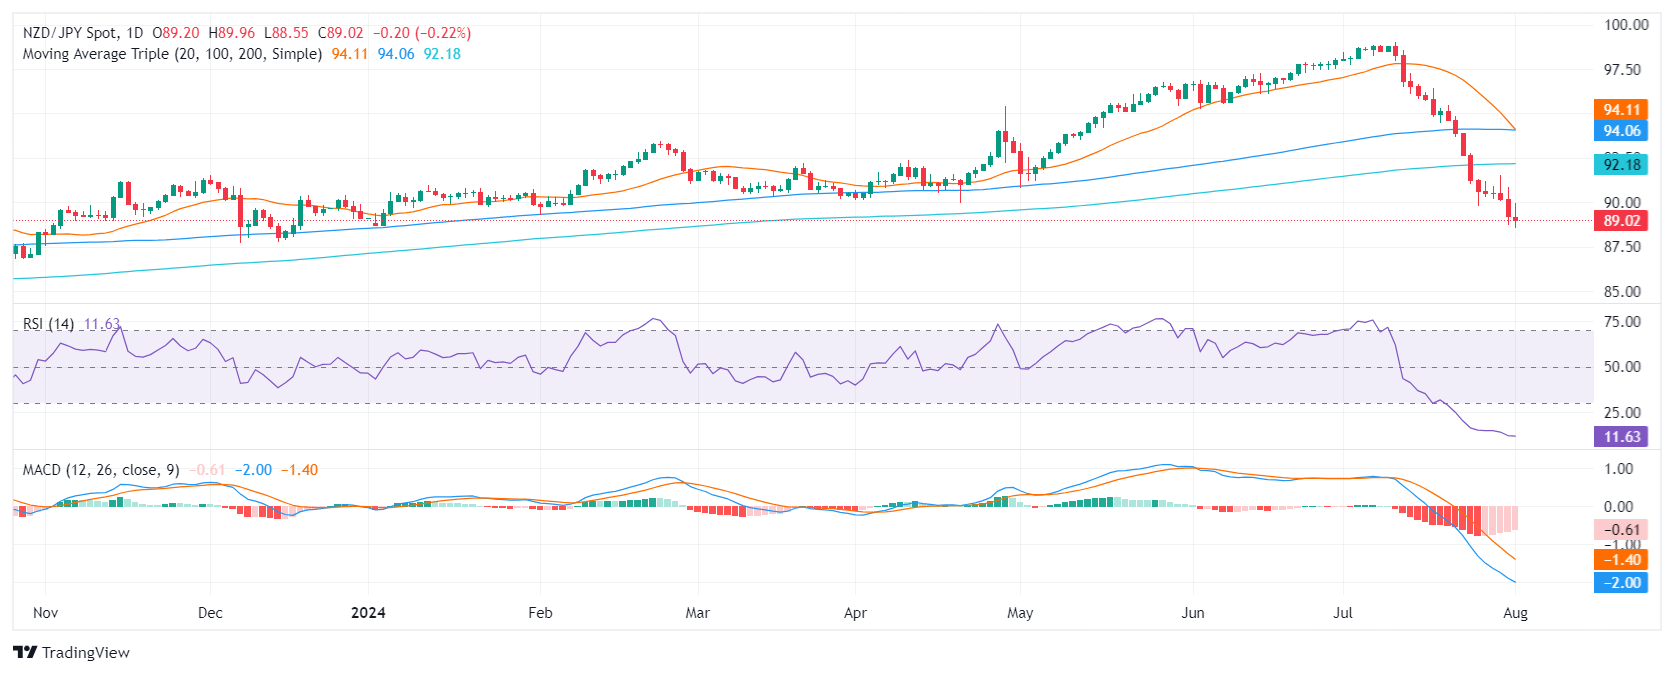
Positioned south of 90.00, the pair is struggling to hold the levels set at 88.50, 88.30 and 88.00. On the contrary, resistance levels are seen at 90.000 and 92.00 around the 200-day SMA.
Source: Fx Street
I am Joshua Winder, a senior-level journalist and editor at World Stock Market. I specialize in covering news related to the stock market and economic trends. With more than 8 years of experience in this field, I have become an expert in financial reporting.


