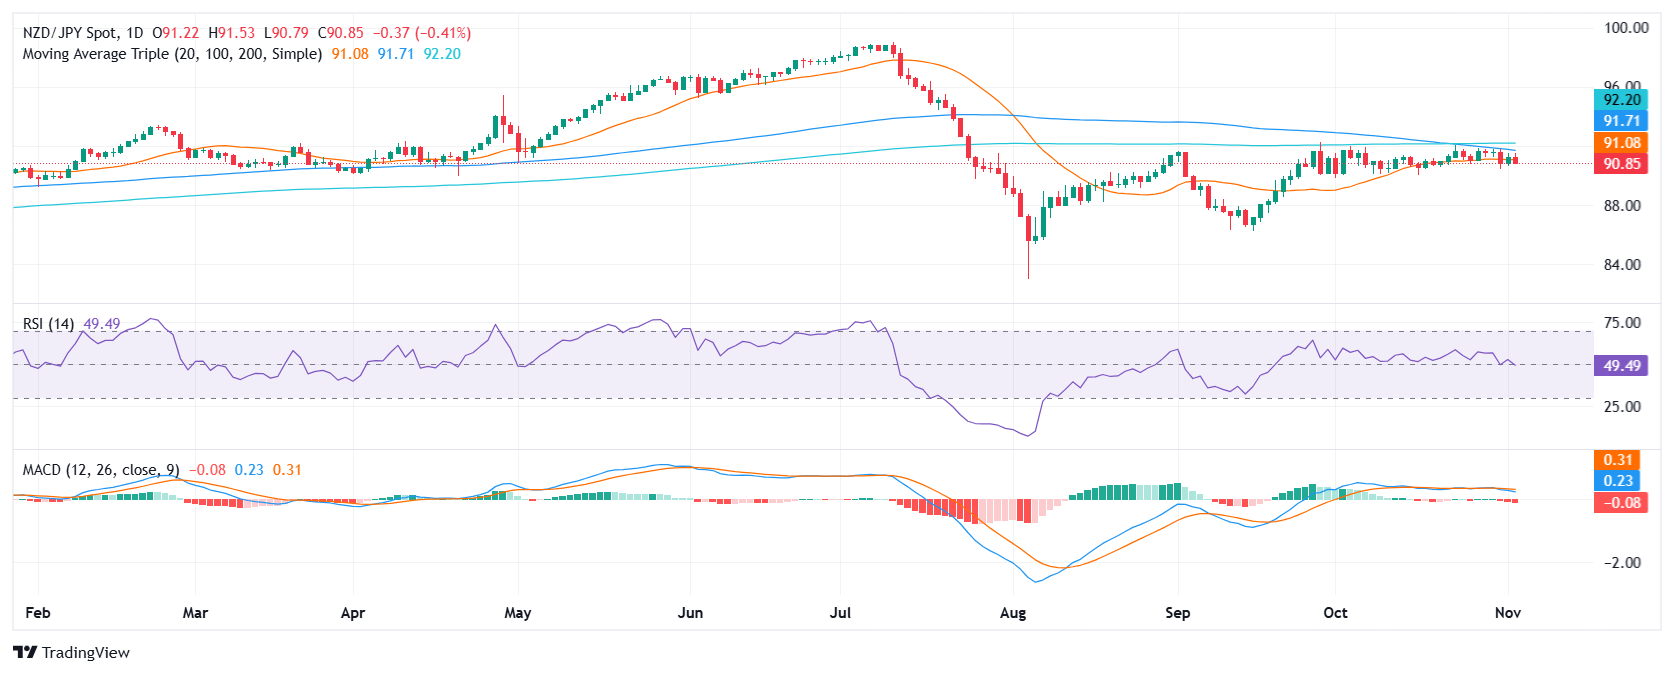
- NZD/JPY extended its decline on Monday, falling to 90.90.
- Technical indicators suggest a bearish outlook, with increasing selling pressure and a declining RSI.
- The 20-day SMA is the last barrier against sellers.
NZD/JPY’s recent sideways move appears to be ending as the pair resumed its decline and fell slightly below the 20-day Simple Moving Average (SMA), below 91.00 on Monday.
The Moving Average Convergence/Divergence (MACD) indicator shows rising red bars, indicating increasing bearish momentum while the Relative Strength Index (RSI) is below 50, with a downward slope, also suggesting a bearish outlook.
Selling pressure is likely to continue, with potential support levels at 90.50, 90.00 and 89.50. If the pair breaks below 90.50, it could signal a further decline. On the other hand, a close above the 91.50 resistance could indicate a trend reversal. However, the overall outlook remains bearish as the MACD and RSI indicators suggest strong selling pressure. Furthermore, the 100-day SMA is close to the 20-day average and more selling pressure should be expected in the event of a bearish crossover.
NZD/JPY daily chart
Source: Fx Street
I am Joshua Winder, a senior-level journalist and editor at World Stock Market. I specialize in covering news related to the stock market and economic trends. With more than 8 years of experience in this field, I have become an expert in financial reporting.


