
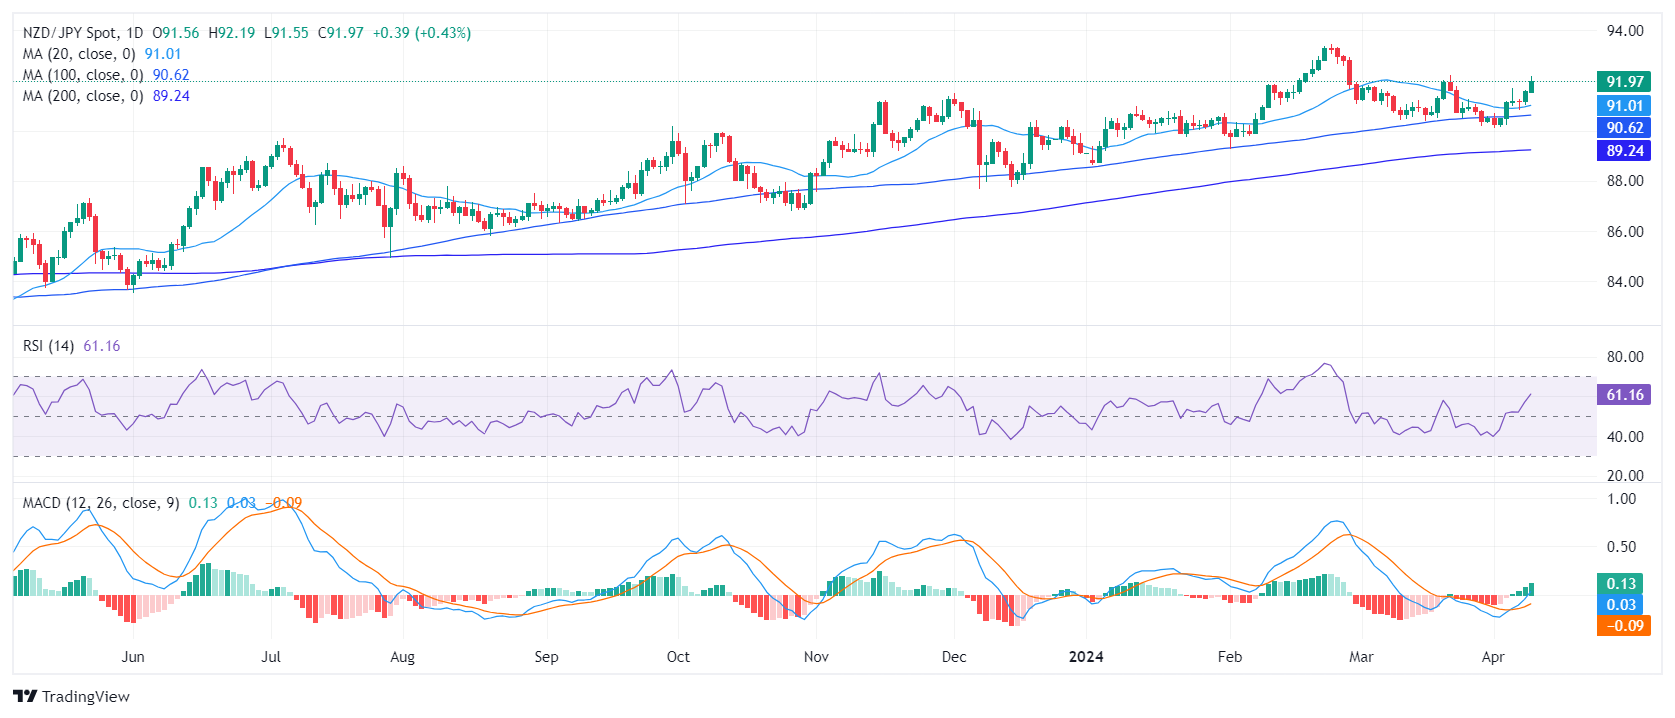
- The daily RSI shows bullish traction, while a positive MACD suggests increasing momentum.
- On the hourly chart, the same indicators point to possible short-term pullbacks due to minor negative momentum.
- Despite a bullish overall outlook, buyers need to defend the short-term SMAs and defend them to avoid potential losses.
The NZD/JPY pair is trading at 91.79, up 0.25%. It is currently showing a strong bullish trend, with reinforced buying momentum as it is positioned comfortably above its main simple moving average (SMA). The indicators are holding firm on the daily chart, while the hourly indicators could be hinting at an imminent consolidation.
On the daily chart, the Relative Strength Index (RSI) is comfortably in positive territory, suggesting that buying pressure outweighs selling pressure. On the other hand, the moving average convergence divergence (MACD) shows ascending green bars, an indication of growing buying momentum.
NZD/JPY daily chart
On the hourly chart, a similar trend is observed. The RSI took a hard hit during the American session and appears to be slowly recovering. The hourly MACD, however, features red bars, hinting at possible short-term negative momentum. Therefore, day traders should proceed with caution.
NZD/JPY hourly chart
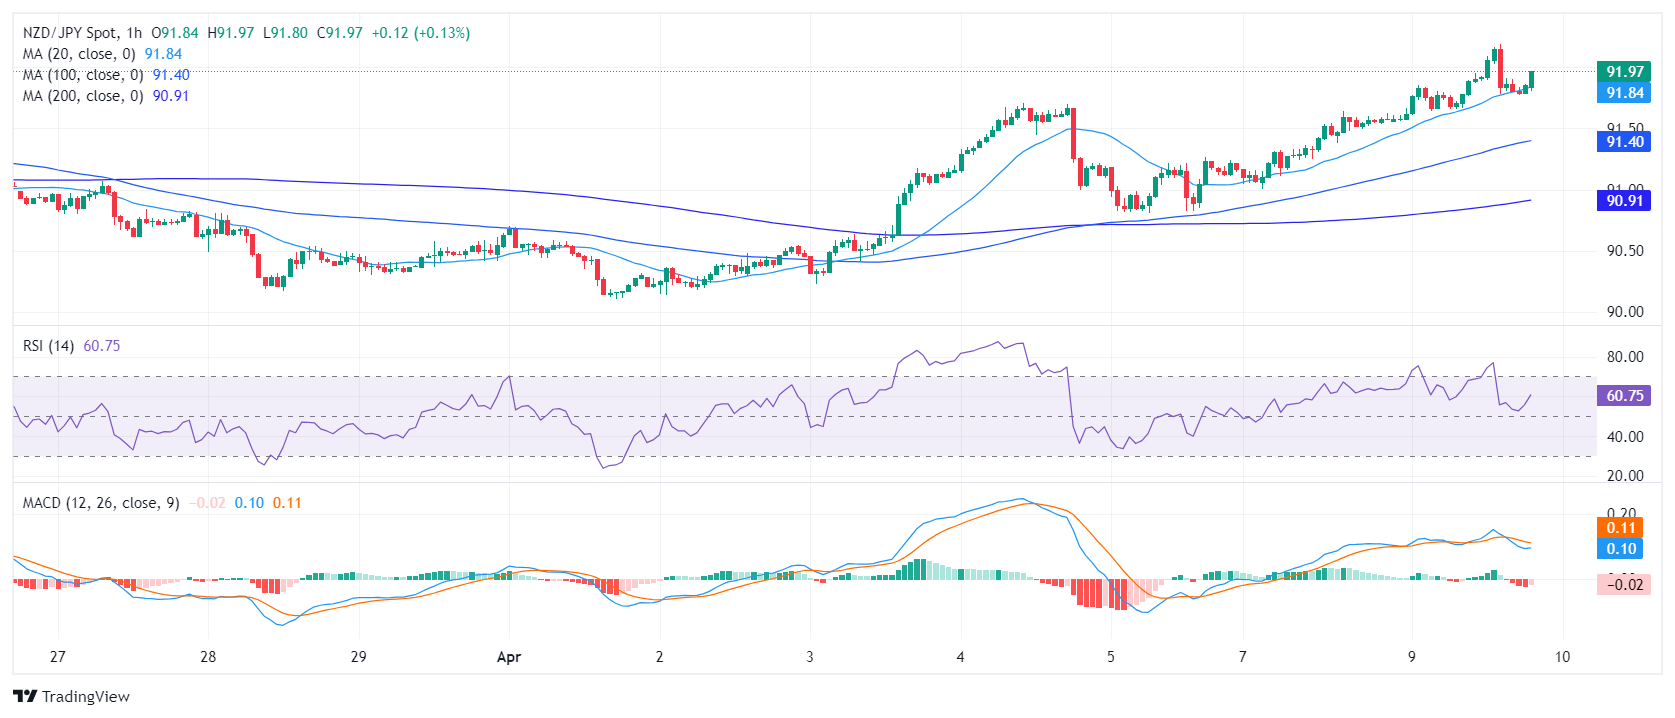
Looking at the bigger picture, NZD/JPY maintains its position above the 20-day, 100-day and 200-day SMAs, indicating sustained long-term buying pressure. Therefore, both the short-term and long-term technical outlook for the pair seem to point to an uptrend. In summary, while the hourly MACD reveals slight negativity that may produce some temporary pullbacks, the overall trend for the crossover on both the daily and longer-term chart is bullish.
Source: Fx Street
I am Joshua Winder, a senior-level journalist and editor at World Stock Market. I specialize in covering news related to the stock market and economic trends. With more than 8 years of experience in this field, I have become an expert in financial reporting.


