
- The NZD/USD pair jumped above 0.6090 showing a 0.95% rise on the day.
- Initial claims for US jobless benefits for the week ending June 2 rose to 261,000.
- Falling US yields amid dovish bets on the Fed weakened the dollar.
The pair NZD/USD saw a significant rally, breaking above the 0.6090 level and marking a 0.95% gain on the day. This rise was influenced by multiple factors, including initial US jobless claims for the week ending June 2, which unexpectedly accelerated, fueling subdued expectations ahead of the next Federal Reserve meeting. (Fed). The dollar lost interest due to the drop in US bond yields.
US bond yields fall on jobless claims data, eye on CPI
Initial US jobless claims for the week ending June 2 stood at 261,000, versus 235,000 expected, and accelerated from its previous reading of 233,000. The increase in the number of people applying for unemployment benefits in the US points to the weakness of the labor market amid the tightening monetary policy of the Federal Reserve (Fed), which makes investors anticipate a less aggressive stance for the next meetings. CME’s FedWatch tool suggests investors are more likely to see the Fed refrain from raising rates at its next meeting, scheduled for June 13-14, and instead keep the rate target stable at 5.25%. .
Against this background, US bond yields fell across the curve, with 2-, 5-, and 10-year rates falling.
The upcoming US Consumer Price Index (CPI) data is expected to play the most crucial role in determining the Fed’s decision. Analysts expect the year-on-year inflation rate to drop to 4.2 % in May, up from 4.9% prior, while the core rate will rise to 5.6%, up from 5.5% previously.
NZD/USD levels to watch
According to the daily chart, the NZD/USD pair maintains a neutral to bearish outlook in the short term. Despite the technical indicator showing increasing bullish momentum, the bearish cross made by the 20-day SMA dipping below the 200-day SMA suggests that the negative outlook for the NZD is intact.
On the downside, support levels line up at 0.6050, 0.6030 and the key psychological level of 0.6000. On the other hand, immediate resistance is seen at 0.6115, followed by the 0.6130 – 0.6150 zone, where the aforementioned SMAs traced the bearish crossover.
NZD/USD daily chart
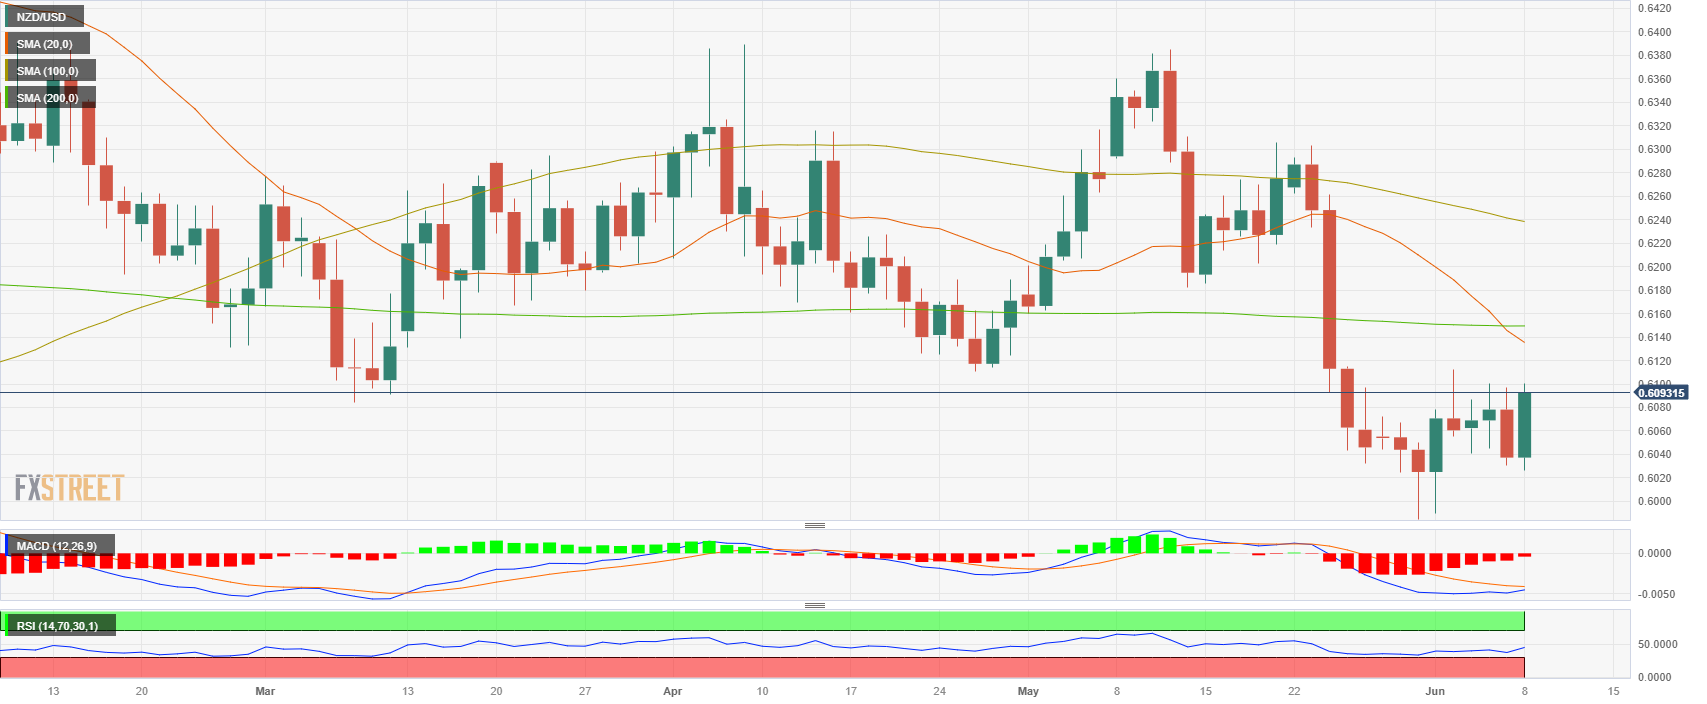
Source: Fx Street
I am Joshua Winder, a senior-level journalist and editor at World Stock Market. I specialize in covering news related to the stock market and economic trends. With more than 8 years of experience in this field, I have become an expert in financial reporting.


