
- The NZD/USD pair is trading at 0.6378 and extending its gains against the USD, boosted by recent US inflation data.
- The US Producer Price Index (PPI) for June rose 0.1%m/m, disappointing estimates of 0.2%, indicating a slowdown in US factory inflation.
- Initial US jobless claims for the week ending July 6 were lower than expected, suggesting a tight labor market.
The New Zealand Dollar (NZD) extends its gains against the US dollar (USD), buoyed by recent inflation data in the United States (US) on the consumer side, posted a solid deceleration. In addition, today’s economic agenda raised speculation that the Federal Reserve (Fed) is about to end its tightening cycle. At the time of writing, the NZD/USD pair is trading at 0.6378.
US inflation data fuels speculation about Fed tightening cycle, boosting Kiwi
A boost in risk appetite favors riskier currencies such as the Kiwi (NZD), as opposed to the safe-haven dollar. On Thursday, the US Bureau of Labor Statistics (BLS) released crucial inflation and labor market data for the Fed, which is expected to hike rates 25 basis points at its July meeting. The US Producer Price Index (PPI) for the month of July was as follows
The US Producer Price Index (PPI) for June rose 0.1%m/m, exceeding May’s 0.4% decline, but below estimates of 0.2%. In annual terms, the PPI grew by 0.1%. The so-called core PPI, which excludes volatile items, rose 0.1%m/m, unchanged from May, and accelerated below estimates of 0.2%. The annual core PPI cooled off expectations of 2.6% and stood at 2.4%. The data showed that so-called factory inflation is slowing down, in line with Wednesday’s CPI report, which saw CPI drop 1% towards the 3% threshold.
In other data, the BLS revealed initial jobless claims for the week ending July 6, which rose 237,000, below estimates of 250,000, portraying a tight job market. The Fed’s Beige Book showed that labor demand “remained healthy” in June, though it noted that hiring “was becoming more targeted and selective.”
The NZD/USD pair reacted higher to the data, hitting a daily high of 0.6394, before pulling back a few points to current spot prices.
The data from New Zealand (NZ), despite being weaker, with the contraction of the manufacturing sector in June at its lowest level since November 2022, were ignored by investors. Even the latest Reserve Bank of New Zealand (RBNZ) monetary policy decision to keep rates unchanged did little to hinder the NZD/USD’s uptrend.
NZD/USD Price Analysis: Technical Perspective
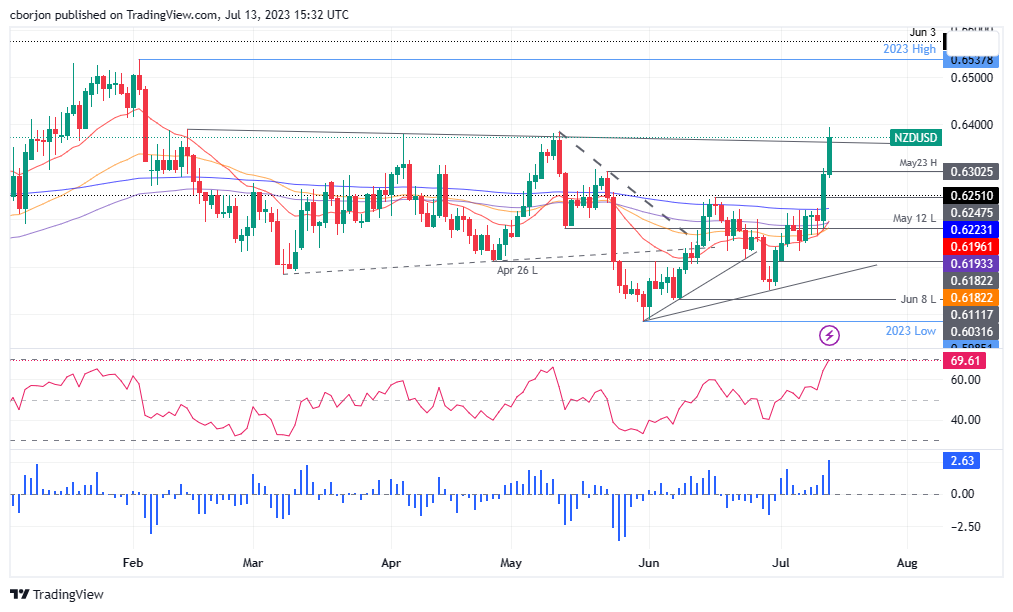
The daily chart of NZD/USD shows the pair neutral to the upside, threatening to extend gains beyond the February 14 swing high at 0.6389, which could bring 0.6400 into play if breached. Once this figure recovers, the NZD/USD yearly high at 0.6538 would be about to be challenged. However, traders need to hit a daily close above 0.6389 to consolidate the case for higher prices. Conversely, the first support for the NZD/USD would be the 0.6300 level. Sellers would stay tuned as they would like to test the 200 day EMA at 0.6223, but first need to recapture the June 16 daily high turned support at 0.6248 as they are in their sights. the barrier of 0.6200.
Source: Fx Street
I am Joshua Winder, a senior-level journalist and editor at World Stock Market. I specialize in covering news related to the stock market and economic trends. With more than 8 years of experience in this field, I have become an expert in financial reporting.


; Find out where to watch the movie on the topic")

