
- US Bureau of Labor Statistics (BLS) report reveals lower-than-expected initial jobless claims, spurring recovery in US Treasury yields.
- US 2-year and 10-year Treasury yields rose ten basis points each, reaching 4.873% and 3.852%, respectively.
- Divergences between the monetary policies of the Fed and the RBNZ could influence the continuation of the bearishness of the NZD/USD.
The pair NZD/USD falls for the fifth day in a row, while the US dollar (USD) strengthens after employment data continues to show labor market tightness, causing a reaction in US Treasury yields, which rise. Thus, the NZD/USD pair is trading at 0.6229, losing 0.4%, after reaching a daily maximum above the 0.6300 figure.
Kiwi Faces Headwinds as US Job Market Tensions Strengthen Dollar and Send Treasury Yields Higher
A report from the US Bureau of Labor Statistics (BLS) showed jobless claims for the week ending July 15 fell below estimates, spurring a rally in US Treasury yields. Initial jobless claims rose by 228,000, below forecasts of 240,000, while continuation claims, which lagged behind the current claims week reported, increased by 33,000, to 1,754 million, from 1,721,000.
Following the data, as mentioned above, US 2-year and 10-year Treasury yields soared: 2-year Treasury yields rose ten basis points (bp) to 4.873%, while 10-year Treasury yields followed suit, up 10 bp to 3.852%.
Following the reaction of US bond yields, the Dollar rose, as the Dollar Index (DXY) shows. The DXY, which tracks the Dollar against a basket of six currencies, is up 0.51% to 100.796, putting a headwind for NZD/USD as traders reassess a potential Federal Reserve rate hike after the July meeting.
The CME’s FedWatch tool shows that investors are taking for granted a 25 basis point rate hike in July. However, the odds of a rate hike in November are back on investors’ minds, with the odds standing at 32.2%, up from 19.8% a week ago.
On the New Zealand front, recent Reserve Bank of New Zealand (RBNZ) monetary policy saw the RBNZ hold rates unchanged at 5.5% as the central bank signaled that consumer spending has eased, helping to cool inflation. According to the latest inflation report, the second quarter Consumer Price Index (CPI) slowed from 6.7% to 6%, in line with the RBNZ forecast.
Given the fundamental background, with monetary policy divergences between the Fed and the RBNZ, the NZD/USD pair could continue to trend lower unless next month’s NZ inflation numbers prompt the RBNZ board to take action to control inflation.
NZD/USD Price Analysis: Technical Perspective
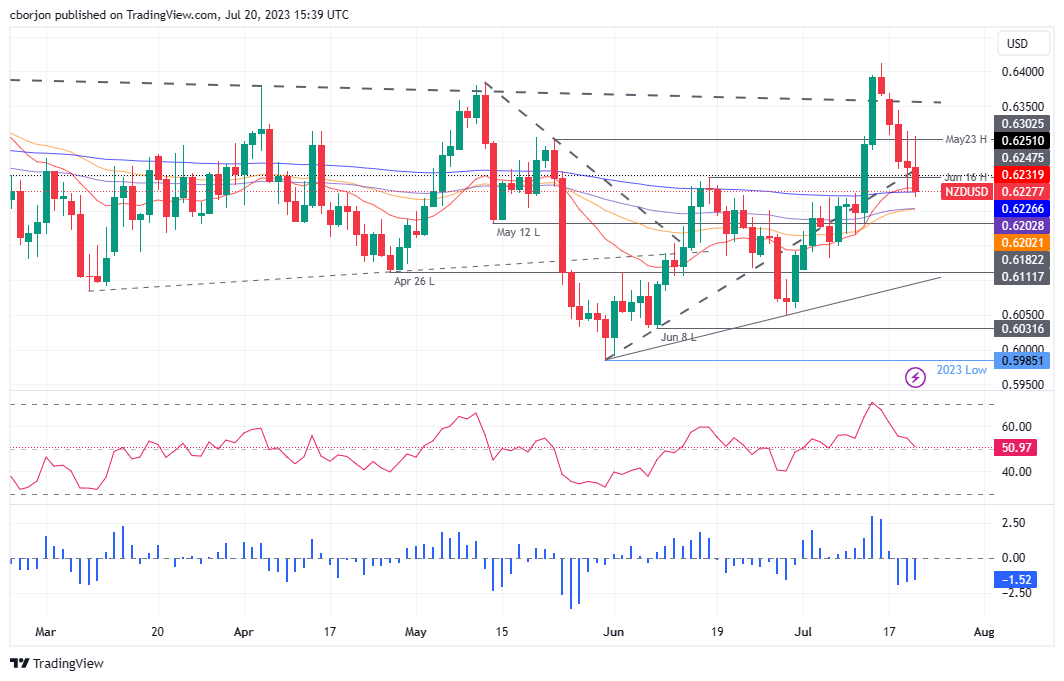
The failure of NZD/USD buyers to reach 0.6300 exposed the pair to selling pressure, with the major pair extending its losses towards the 200 day EMA at 0.6226. It should be noted that the pair has fallen to the latter twice in recent days, but has not achieved a daily close that changes the trend to neutral. Furthermore, the 20-day EMA at 0.6232 cushioned the decline in NZD/USD, which if it breaks the 0.6232/26 zone, poses a challenge to 0.6200. On the other hand, if the NZD/USD moves towards 0.6300, the trend would remain intact.
Source: Fx Street
I am Joshua Winder, a senior-level journalist and editor at World Stock Market. I specialize in covering news related to the stock market and economic trends. With more than 8 years of experience in this field, I have become an expert in financial reporting.


