
- The New Zealand business PMI worsened early on Friday, weighing on the NZD.
- The New Zealand CPI will be published on Monday.
The pair NZD/USD is experiencing a slight decline heading into the close of the week, which has seen the pair sit firmly in red territory for the week.
Early on Friday, the NZ Purchasing Managers’ Index (PMI) showed a further decline in the confidence indicator, to 45.3, from 46.1 previously.
New Zealand traders’ attention will now turn to the New Zealand Consumer Price Index (CPI) inflation figures, which will be released late on Monday at 21:45 GMT.
New Zealand CPI inflation is expected to turn around, rising quarter-on-quarter to 1.1% to 2%, while the third quarter annualized figure is expected to decline slightly from 6% to 5.9%.
The Reserve Bank of New Zealand (RBNZ) is currently in a holding pattern regarding interest rates, and both investors and the RBNZ will be monitoring inflation closely.
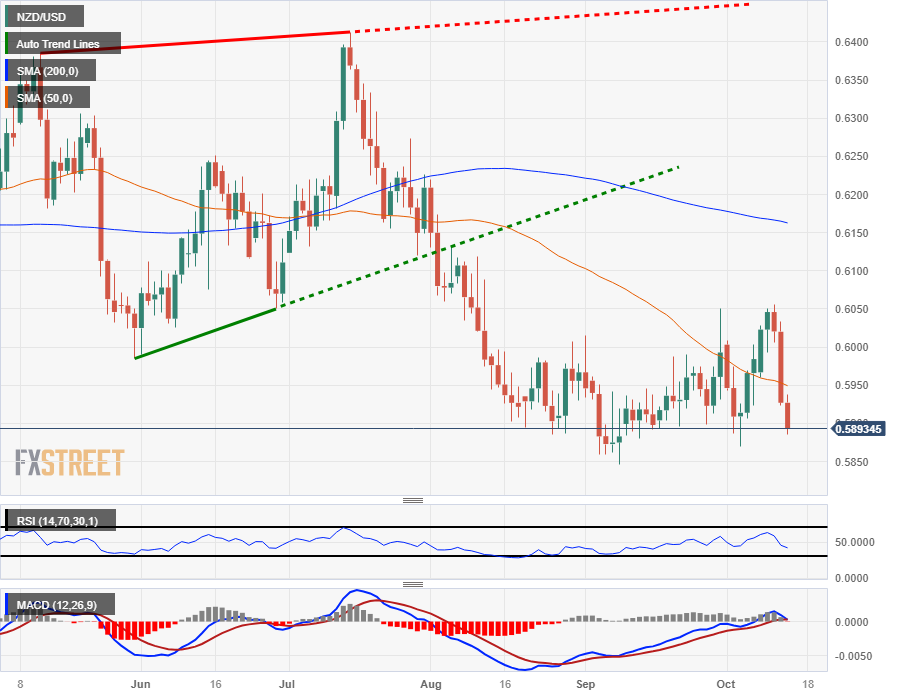
NZD/USD Technical Outlook
On intraday charts, the Kiwi declines firmly against the US Dollar, with NZD/USD retreating 2.75% from week’s highs at 0.6055.
The pair declines directly through the 200 hourly SMA on Thursday’s broad market move towards the US dollar, and the Kiwi failed to establish a significant reversal on the charts, rising to a meager high of 0.5936 in Friday trading before falling again and hitting a short-term low of 0.5886.
The daily candlesticks show NZD/USD re-consolidating at the bottom of the medium-term consolidation, and the Kiwi is stuck for a major bottom at the year’s lows near 0.5850. Price action is getting stuck at the 50-day SMA as momentum bleeds into the daily charts, and a bearish 200-day SMA is turning lower towards 0.6150.
NZD/USD Daily Chart
NZD/USD Technical Levels
Source: Fx Street
I am Joshua Winder, a senior-level journalist and editor at World Stock Market. I specialize in covering news related to the stock market and economic trends. With more than 8 years of experience in this field, I have become an expert in financial reporting.


