
- NZD/USD hovers around 0.5800 amid overall US dollar strength.
- Mixed sentiment keeps some high beta currencies bullish, albeit capped by dollar momentum.
- The US 3-month and 10-year yield curve is inverted, exacerbating recession fears.
NZD/USD advanced slightly during the middle of the North American session, despite the overall strength of the US dollar, although the New Zealand dollar, after hitting a fresh three-day low, bounced back and reclaimed the 0.5800 figure. At the time of writing, the NZD/USD is trading at 0.5812, almost sideways.
NZD/USD fluctuates as investors brace for Fed
US stocks are trading mixed due to deteriorating sentiment. Some regional banks of the US Federal Reserve released the PMI and business indices, specifically the Chicago and Dallas Fed. Chicago’s manufacturing PMI came in at 45.2, below estimates of 47.0, while the Dallas Fed manufacturing business index fell further to -19.4, versus -17.4 forecast, exacerbating fears of US recession in financial markets.
Additionally, traders should note that the spread between US 3-month and 10-year interest rates turned negative, meaning the yield curve inverted for the first time since March 2020, exacerbating US recession fears
Meanwhile, geopolitical fears such as Ukraine’s grain export blockade by Russia coupled with weaker-than-estimated China PMI figures are likely to keep the safe-haven dollar underpinned, even though it is likely cause the US economy to enter a recession.
Additionally, the lack of top-tier economic data keeps traders focused on the Fed’s decision. However, NZD/USD traders should note that the November 1 ISM Manufacturing PMI for October could be the first token of some of the usual “leading” indicators to signal an impending US slowdown. Also, the JOLT report and the ADP employment change, ahead of the Fed’s monetary policy meeting, would shed some light on the future outcome of the US dollar.
NZD/USD Daily Chart
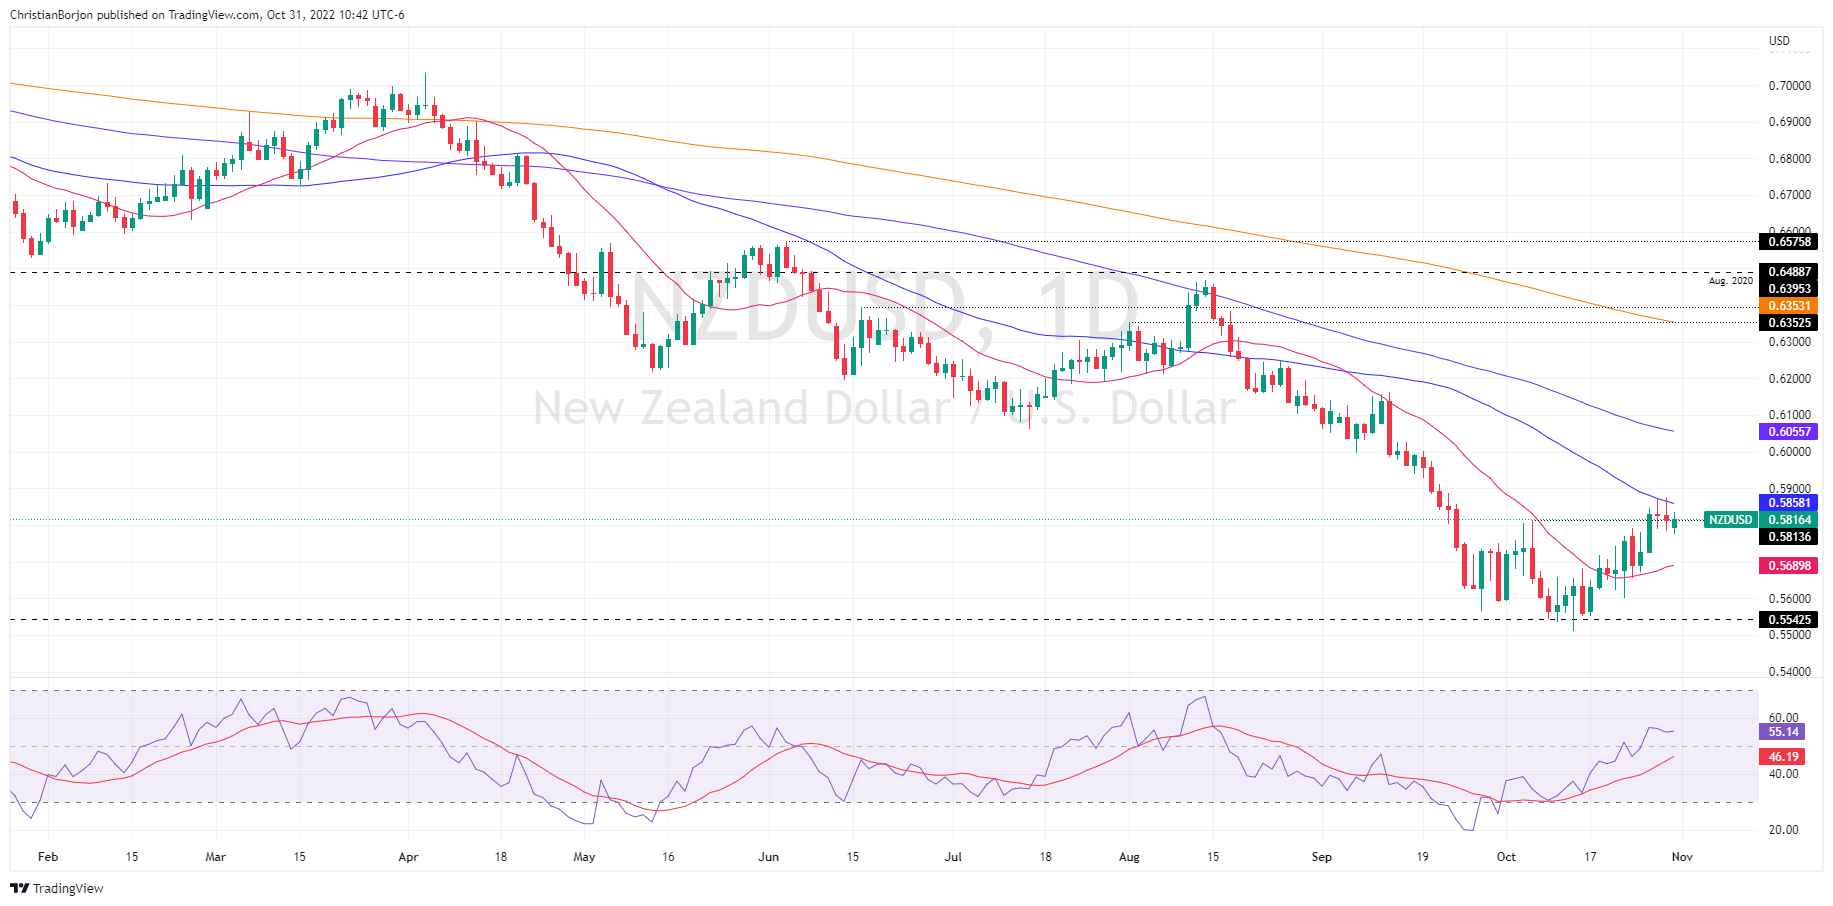
Source: Fx Street
With 6 years of experience, I bring to the table captivating and informative writing in the world news category. My expertise covers a range of industries, including tourism, technology, forex and stocks. From brief social media posts to in-depth articles, I am dedicated to creating compelling content for various platforms.


