
- The NZD/USD quotes around 0.6045 on Friday after reaching an intradic maximum of 0.6079.
- The pair remains within an ascending wedge formation, typically a bearish configuration.
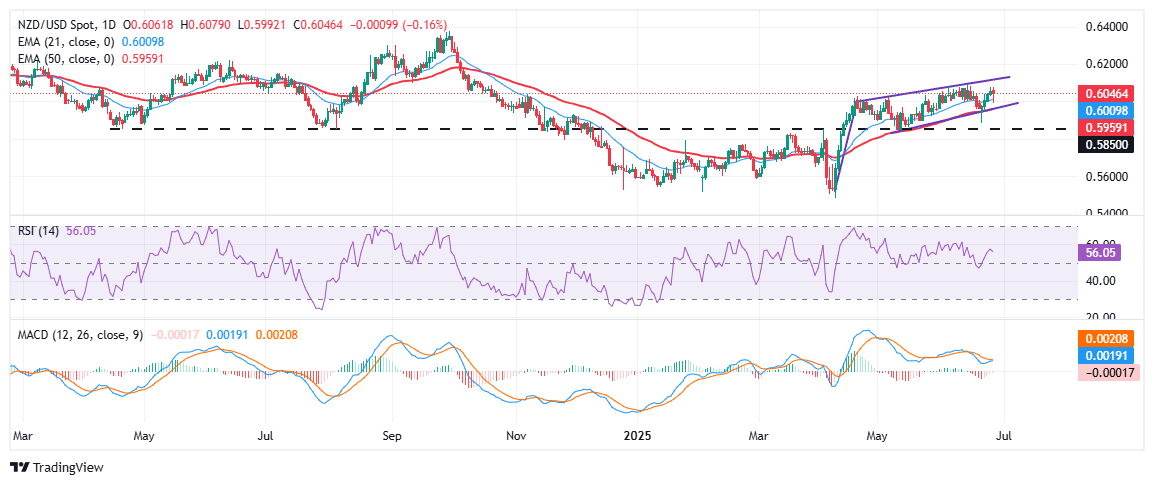
- The NZD/USD reached 0.6089 on June 16, marking its maximum of the year, but since then it has lacked upward.
The NZD/USD struggles to extend its recent progress on Friday, oscillating about 0.6045 after an intradic maximum of 0.6079. The pair remains caught within an upward wedge formation, typically a bearish signal, while the US dollar, generally weak, stabilizes. The US dollar index (DXY) remains above the threshold of 97.00, limiting the strong decline of the dollar and weighing on the kiwi rise.
From a technical perspective, the NZD/USD remains limited within an ascending wedge formation that has been developed since the end of April, a pattern that is often considered a precursor to a bassist reversal. The pair reached its maximum in 0.6089 on June 16, marking its maximum of the year, but since then it has failed to register a higher maximum, which suggests a growing upward exhaustion. The 21 -day exponential (EMA) mobile average about 0.6010 continues to offer dynamic support, while the 50 -day EMA at 0.5955 is presented as the following key defense line in case of a break.
Impulse indicators are beginning to show early warning signs. The Relative Force Index (RSI) is located just about 55, lacking a strong directional bias, while the convergence-distress indicator of the mobile mean (MacD) shows signs of convergence, suggesting that the bullish impulse may be fading.
A rupture confirmed below the wedge support – currently close to the psychological level of 0.6000 – could trigger a more pronounced decrease towards 0.5950, with deeper losses that could be directed towards the 0.5850 area, which acted as the basis for the rebound from April to June.
On the positive side, the bulls would need to break strongly above the maximum of the year of 0.6089 to cancel the downt narrative of the wedge. A clean rupture of the aforementioned resistance, the upper wedge limit, could see when extending to the level of 0.6150–0.6220, last seen in October 2024.
New Zealander dollar today
The lower table shows the percentage of change of the New Zealand dollar (NZD) compared to the main coins today. New Zealand dollar was the strongest currency against the Canadian dollar.
| USD | EUR | GBP | JPY | CAD | Aud | NZD | CHF | |
|---|---|---|---|---|---|---|---|---|
| USD | 0.01% | 0.31% | 0.22% | 0.63% | 0.47% | 0.28% | -0.02% | |
| EUR | -0.01% | 0.25% | 0.19% | 0.61% | 0.43% | 0.13% | -0.09% | |
| GBP | -0.31% | -0.25% | -0.02% | 0.33% | 0.17% | -0.07% | -0.25% | |
| JPY | -0.22% | -0.19% | 0.02% | 0.40% | 0.23% | -0.12% | -0.18% | |
| CAD | -0.63% | -0.61% | -0.33% | -0.40% | -0.13% | -0.47% | -0.61% | |
| Aud | -0.47% | -0.43% | -0.17% | -0.23% | 0.13% | -0.29% | -0.43% | |
| NZD | -0.28% | -0.13% | 0.07% | 0.12% | 0.47% | 0.29% | -0.14% | |
| CHF | 0.02% | 0.09% | 0.25% | 0.18% | 0.61% | 0.43% | 0.14% |
The heat map shows the percentage changes of the main currencies. The base currency is selected from the left column, while the contribution currency is selected in the upper row. For example, if you choose the New Zealand dollar of the left column and move along the horizontal line to the US dollar, the percentage change shown in the box will represent the NZD (base)/USD (quotation).
Source: Fx Street
I am Joshua Winder, a senior-level journalist and editor at World Stock Market. I specialize in covering news related to the stock market and economic trends. With more than 8 years of experience in this field, I have become an expert in financial reporting.


