
- NZD/USD is matching Monday’s losses, rising 0.84%.
- From a daily chart standpoint, NZD/USD has a neutral bias to the upside, although it needs to break above 0.6200.
- A rising channel on the NZD/USD 4-hour chart will sharpen a recovery towards 0.6300.
The New Zealand dollar (NZD) trims Monday’s losses and breaks back above the 0.6100 level due to general US dollar (USD) weakness, as market sentiment has improved, although it remains fragile. Therefore, NZD/USD is trading at 0.6148, up 0.80% from its opening price, after hitting a daily low of 0.6094.
NZD/USD Price Analysis: Technical Perspective
From a daily chart point of view, the NZD/USD has a neutral to bullish bias, consolidating over the last six days, within the 0.6100 – 0.6200 range. Of note, NZD/USD broke out of a falling channel six days ago, a solid breakout, meaning the principal could rally towards higher prices. However, although in bullish territory, the Relative Strength Index (RSI) is heading lower, which means that buyers are either losing momentum or getting a breather before challenging the 200 day EMA. at 0.6303.
In the short term, the 4 hour chart for NZD/USD suggests that a rising channel is forming which, once broken to the upside, would expose key resistance levels. However, NZD/USD is struggling to break above the R1 daily pivot at 0.6150, which, once broken, could open the door towards 0.6200, followed by the August 24 high at 0.6251, before the psychological level of 0.6300.
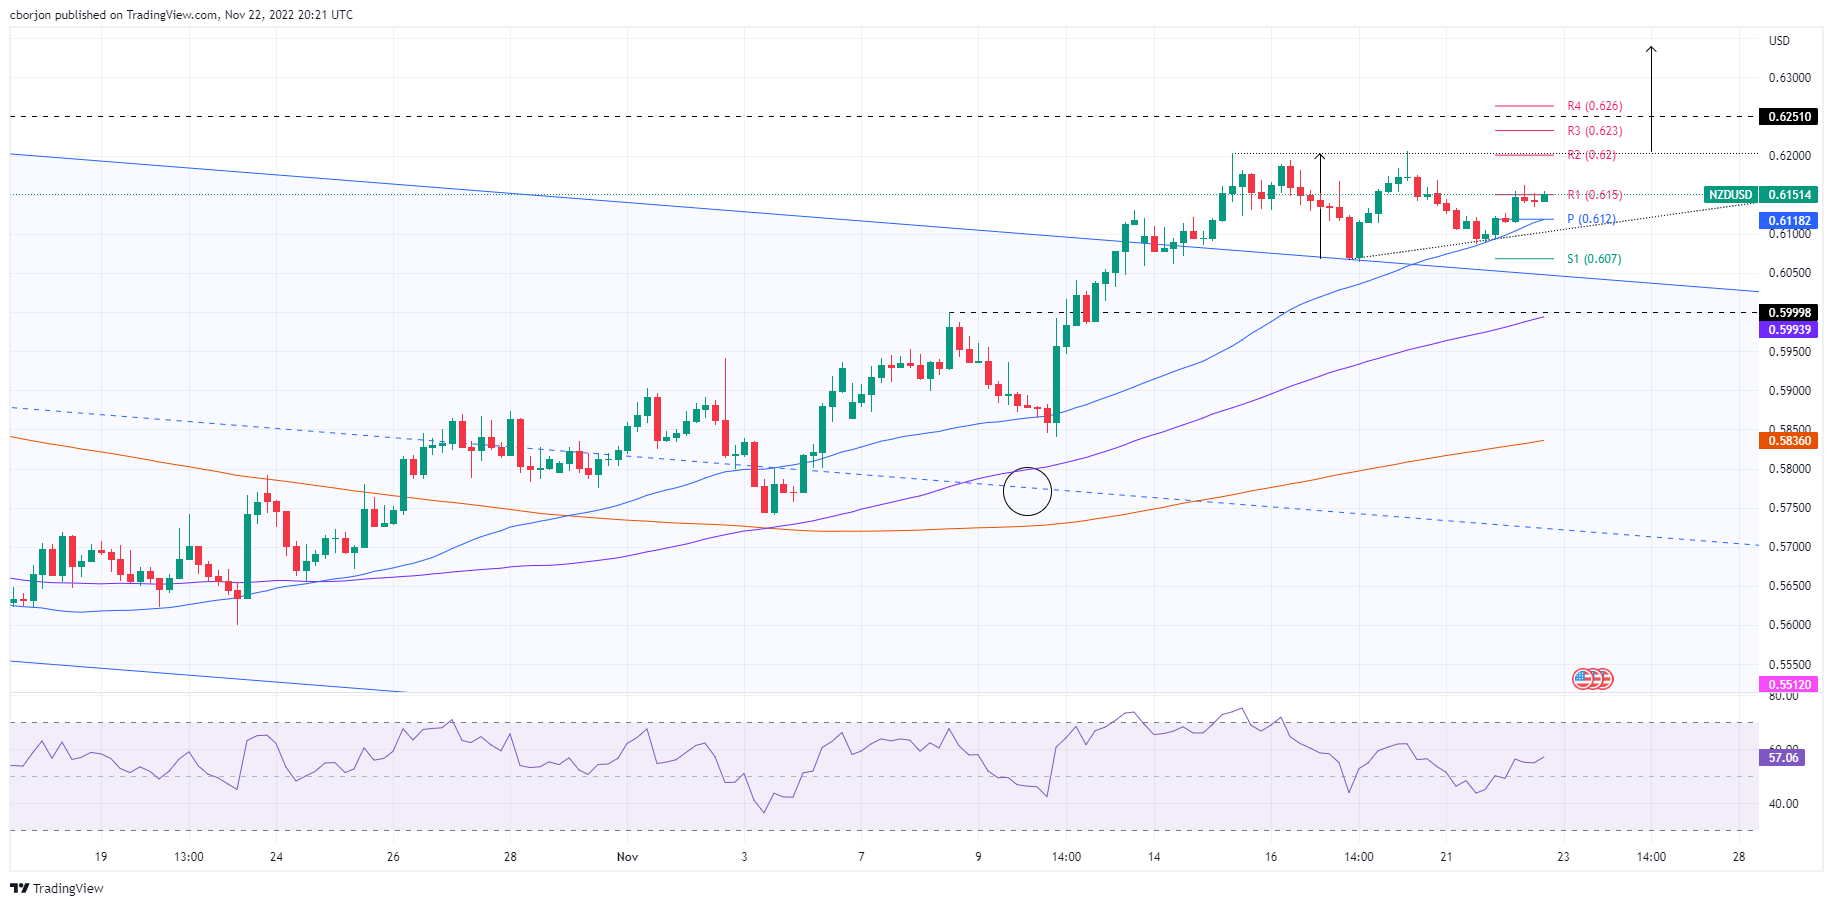
NZD/USD Key Technical Levels
Source: Fx Street
I am Joshua Winder, a senior-level journalist and editor at World Stock Market. I specialize in covering news related to the stock market and economic trends. With more than 8 years of experience in this field, I have become an expert in financial reporting.


