
- NZD/USD fell in the session on Wednesday, continuing its bearish momentum.
- The RSI has fallen to 34, indicating oversold conditions and increasing selling pressure.
- The MACD remains flat and red, suggesting a bearish trend with selling pressure weakening.
In Wednesday’s session, NZD/USD extended its recent decline, down 0.27% to 0.6050. Technical indicators remain bearish, indicating a continuation of the selling pressure that has dominated recent trading sessions.
The Relative Strength Index (RSI) has fallen into oversold territory, with a value of 34 and a sharply declining slope. This suggests that selling pressure is increasing and bears are gaining strength, but that a correction could be on the horizon. The MACD histogram is flat and red, indicating a bearish outlook. As long as the RSI remains below 50 and the MACD remains red, the technical outlook remains bearish for NZD/USD, but sellers should not rule out a healthy correction.
NZD/USD Daily Chart
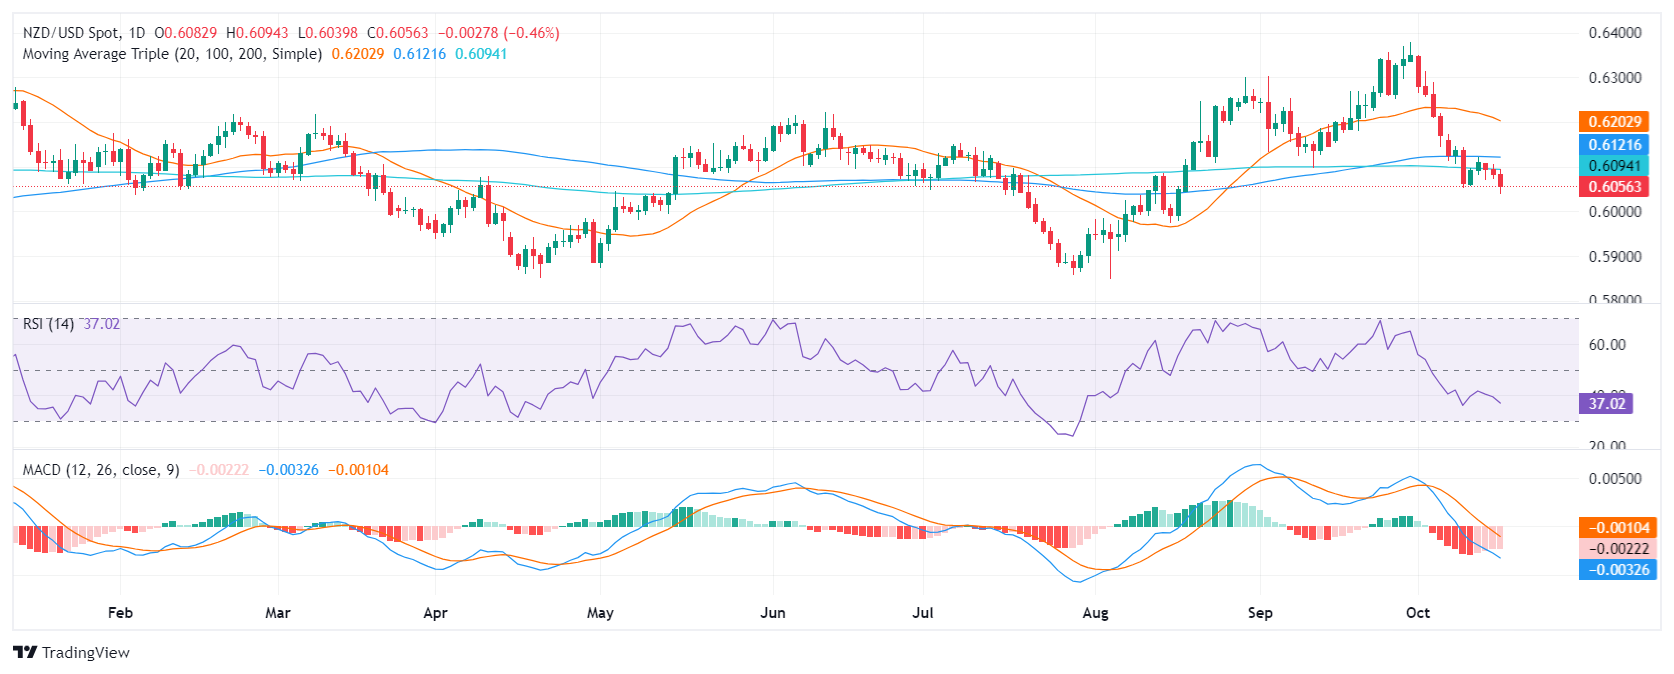
The overall outlook for NZD/USD remains bearish. The pair has been trading below key support levels for several sessions and is yet to show signs of recovery. The 0.6100 area, where the 100-day and 200-day SMA meet, remains a key level to watch, as a consolidation below this level could open the door for a further decline towards 0.6000, while that an upside breakout of this level could trigger a recovery.
Source: Fx Street
I am Joshua Winder, a senior-level journalist and editor at World Stock Market. I specialize in covering news related to the stock market and economic trends. With more than 8 years of experience in this field, I have become an expert in financial reporting.


