
The NZD/USD pair is up 0.5% so far on the day and is heading for a bullish close to start the week. However, breakout traders chasing the move could find themselves in trouble based on the following technical analysis.
NZD/USD weekly chart
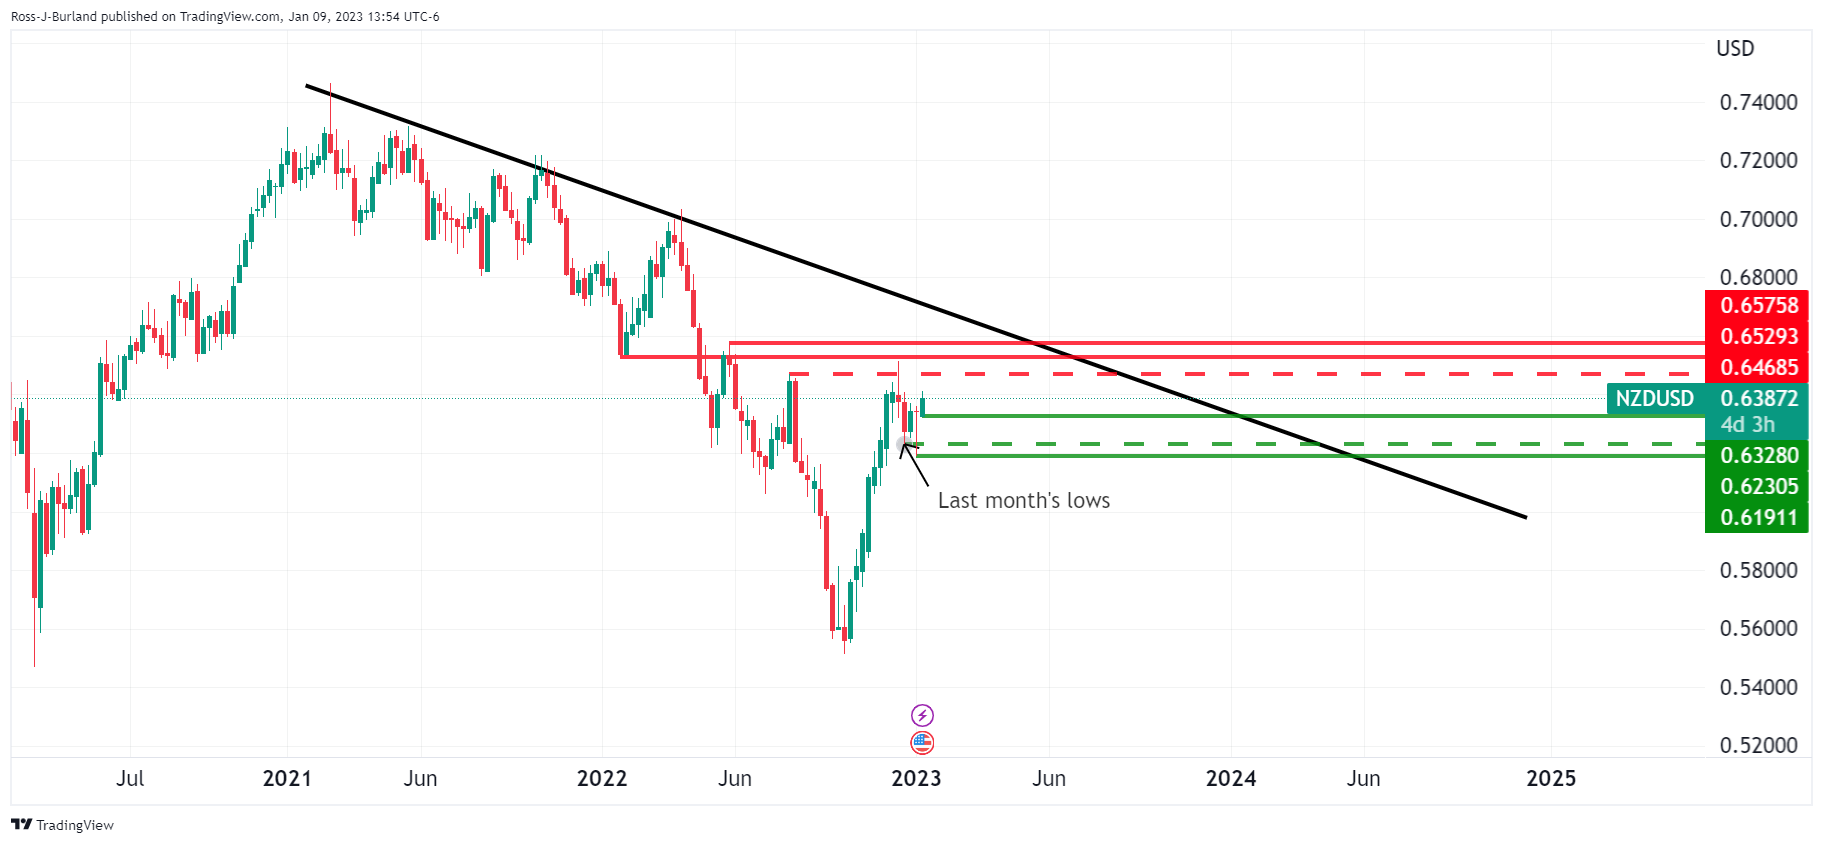
The price touched last month’s low last week, which is a bearish development going forward, while the Kiwi remains in front of the dominant downtrend line and below the next resistance:
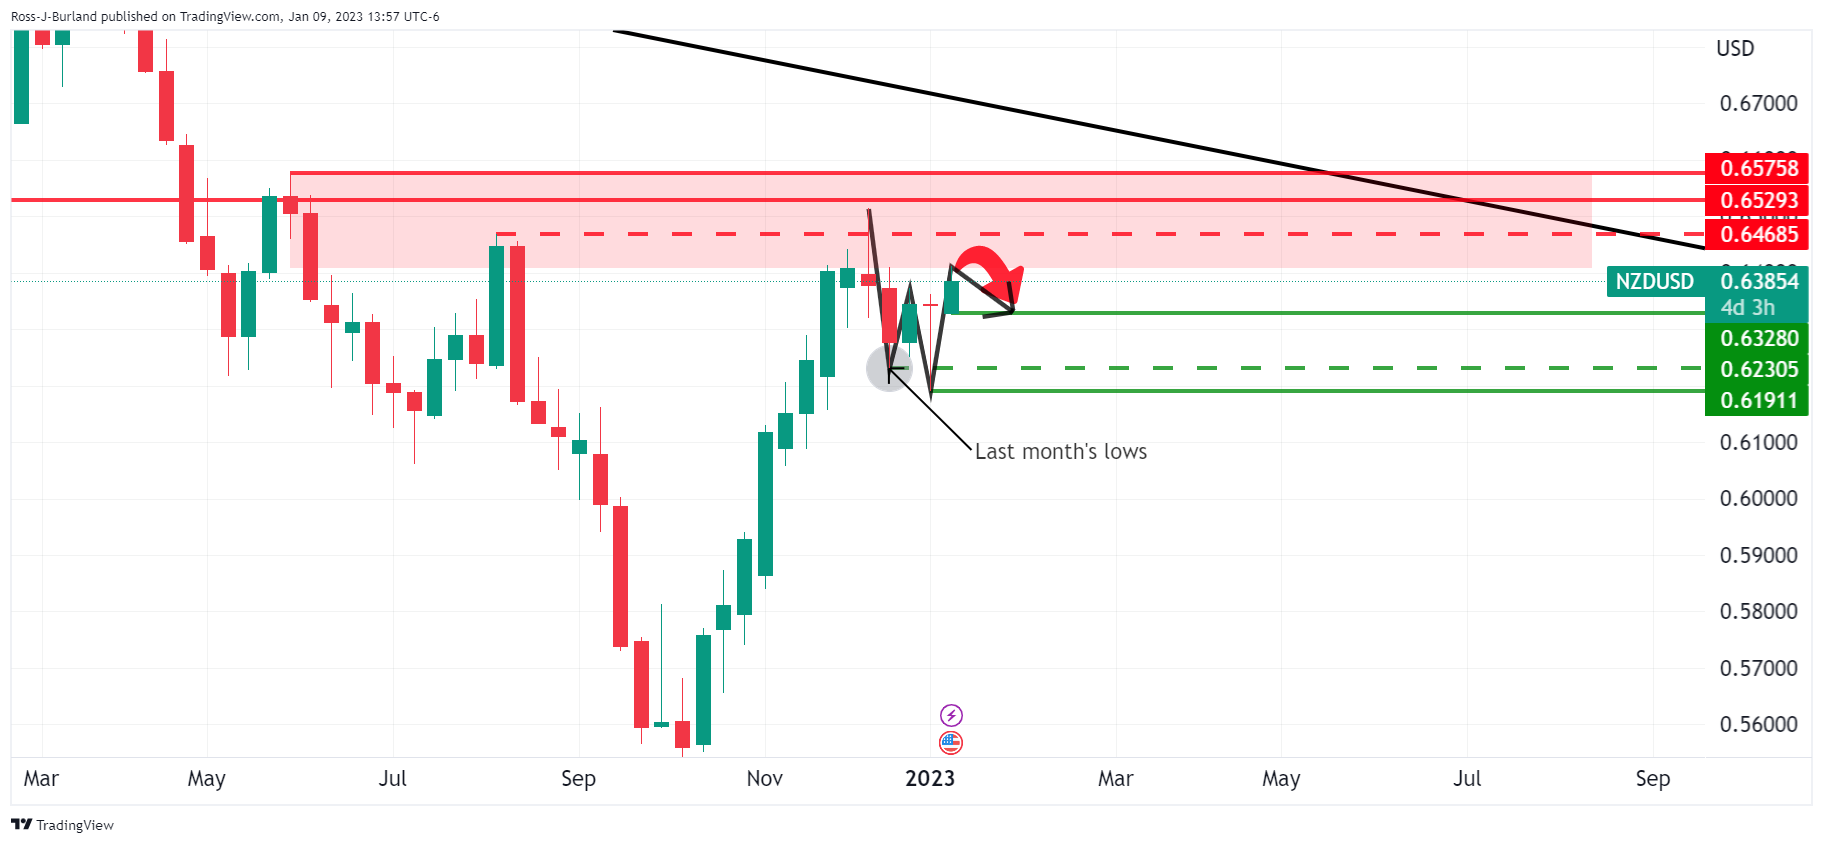
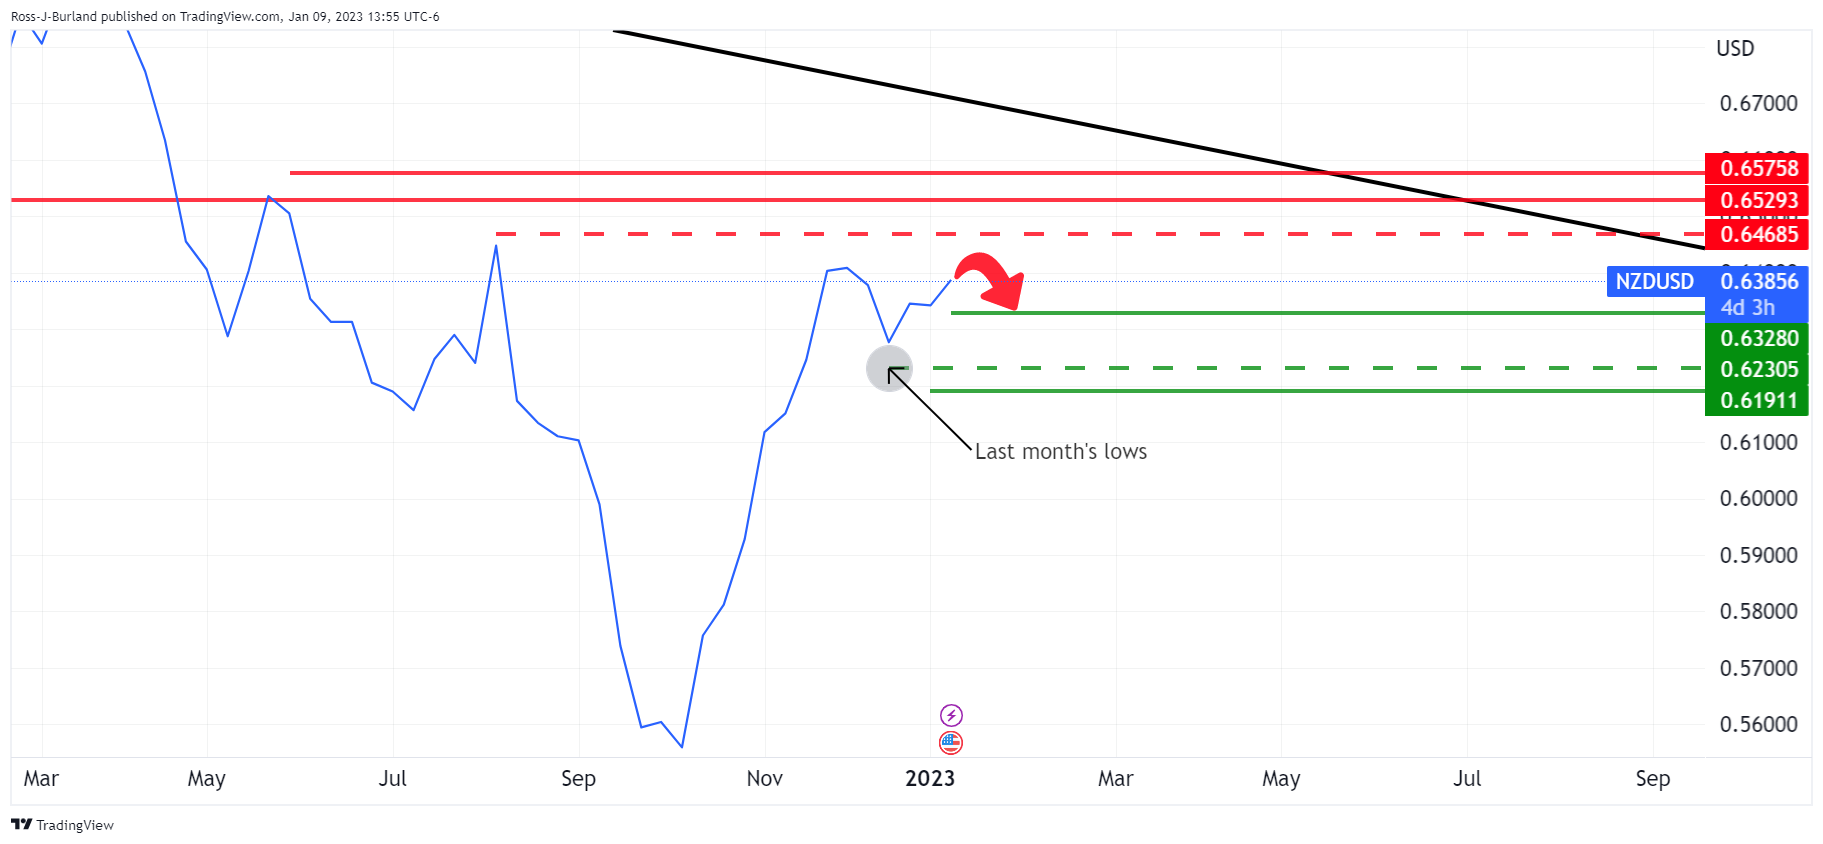
The W formation that is forming is also a bearish trait that could see the price struggling and weighing down on the upside attempts. The formation in W is clearer on the line chart as follows:
NZD/USD daily chart
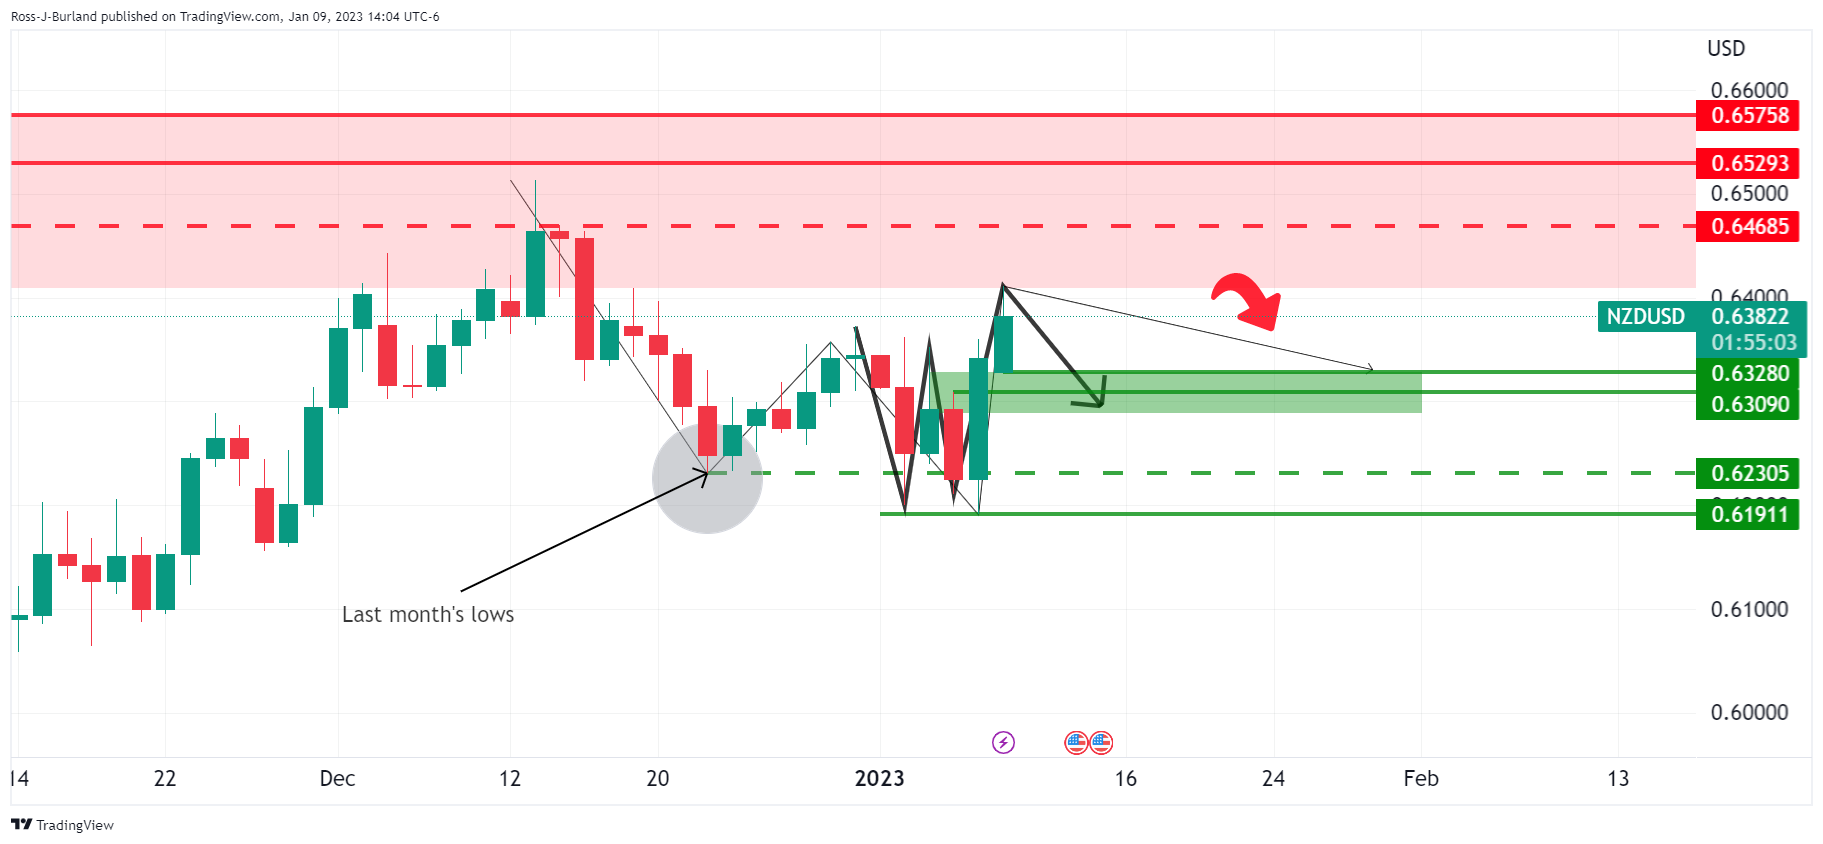
We also have a daily W formation at the close on Monday and this reinforces the bearish outlook for the days ahead as the countdown to the US Consumer Price Index gets underway.
However, this is not to say that a test of resistance cannot take place before the main event on Thursday. This leaves the 0.6470 level exposed. In any case, traders will watch the lower time frames for signs of a slowdown from the bulls that could lead to a break of 0.6200 and the recent lows of 0.6191 in the near future:
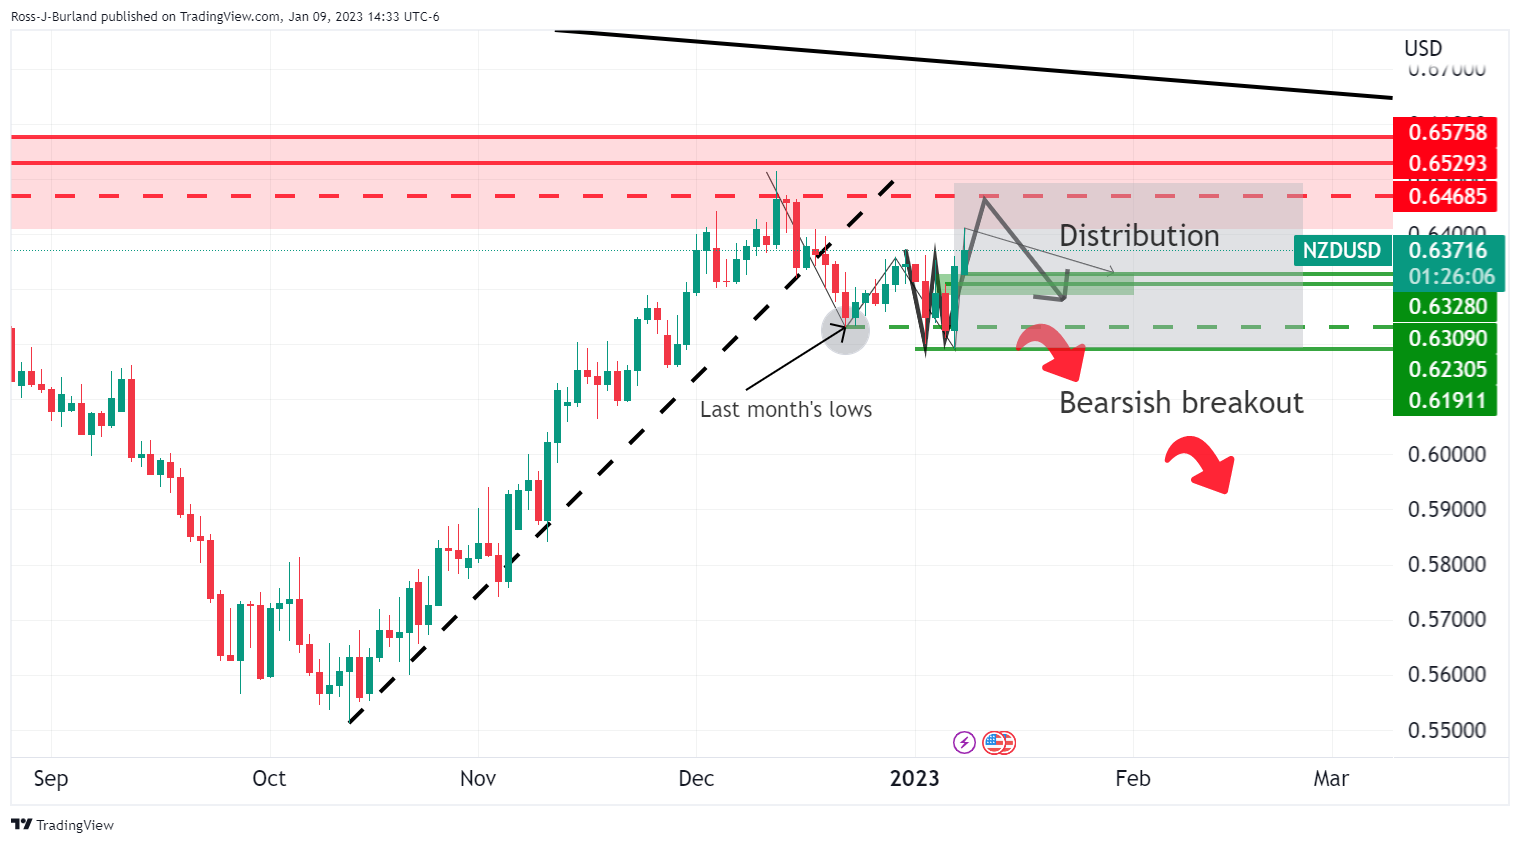
Source: Fx Street
I am Joshua Winder, a senior-level journalist and editor at World Stock Market. I specialize in covering news related to the stock market and economic trends. With more than 8 years of experience in this field, I have become an expert in financial reporting.


