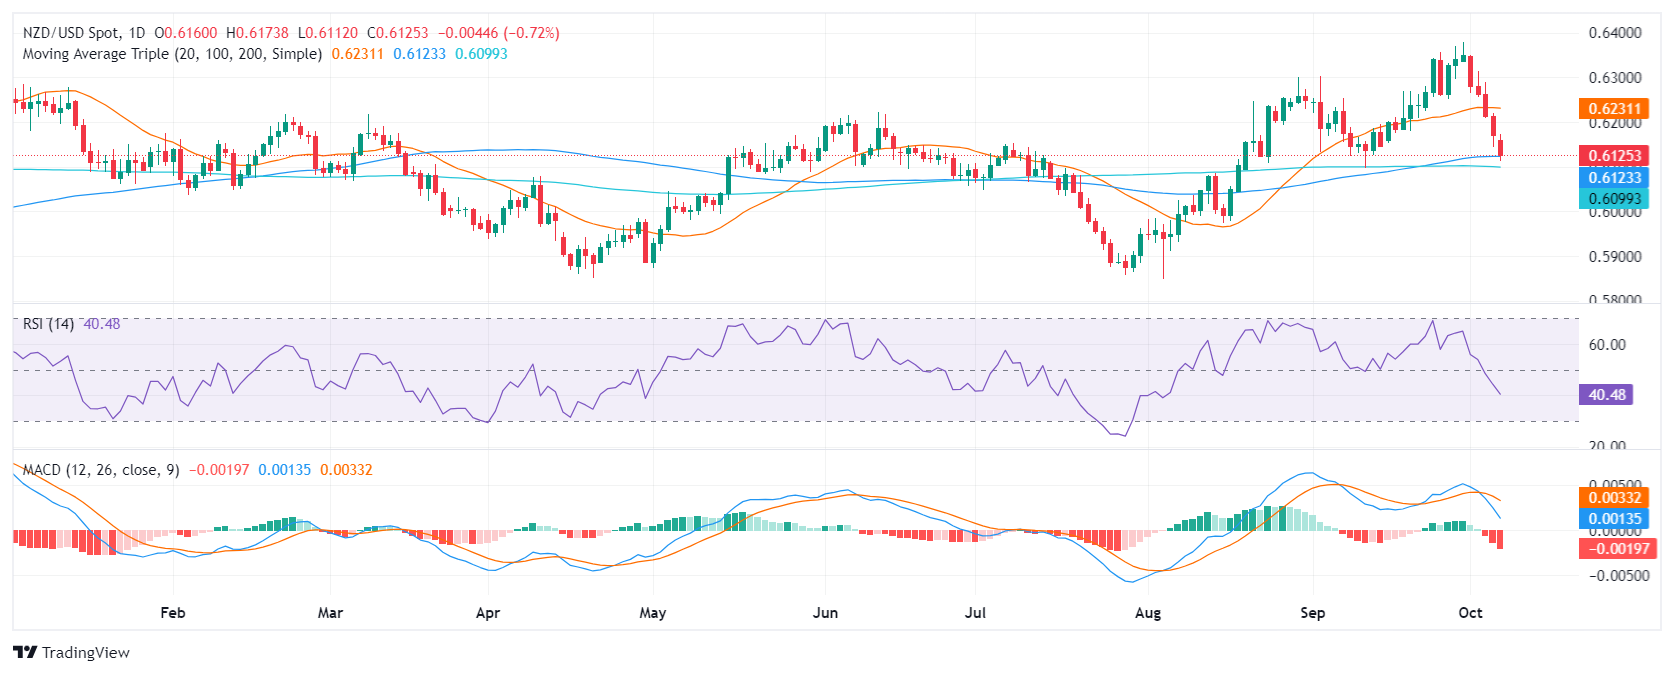
- NZD/USD fell 0.60% to 0.6125, extending its recent downtrend.
- The RSI is in negative territory and declining, while the MACD histogram is in the red and rising.
- A break below 0.6100 could open the door for a further decline towards 0.6000.
In Monday’s session, the NZD/USD pair extended its recent decline, down 0.60% to 0.6125. The pair has been in a downtrend lately, and today’s losses extend that trend. Technical indicators are also bearish, suggesting that selling pressure will likely continue.
The Relative Strength Index (RSI) is currently at 40, which is in negative territory and in sharp decline. This suggests that selling pressure is increasing and the bears are in control of the market. The MACD histogram is also in the red and rising, indicating a bearish outlook. As long as the RSI remains below 50 and the MACD histogram remains in the red, the technical outlook remains bearish for NZD/USD.
NZD/USD daily chart
The overall outlook for NZD/USD is bearish as the pair lost its 20-day SMA. On the positive side, sellers found a barrier at the 100-day SMA at 0.6120, which may mitigate short-term losses. That said, a break below this level could open the door for a further decline towards 0.6000.
Source: Fx Street
I am Joshua Winder, a senior-level journalist and editor at World Stock Market. I specialize in covering news related to the stock market and economic trends. With more than 8 years of experience in this field, I have become an expert in financial reporting.


