
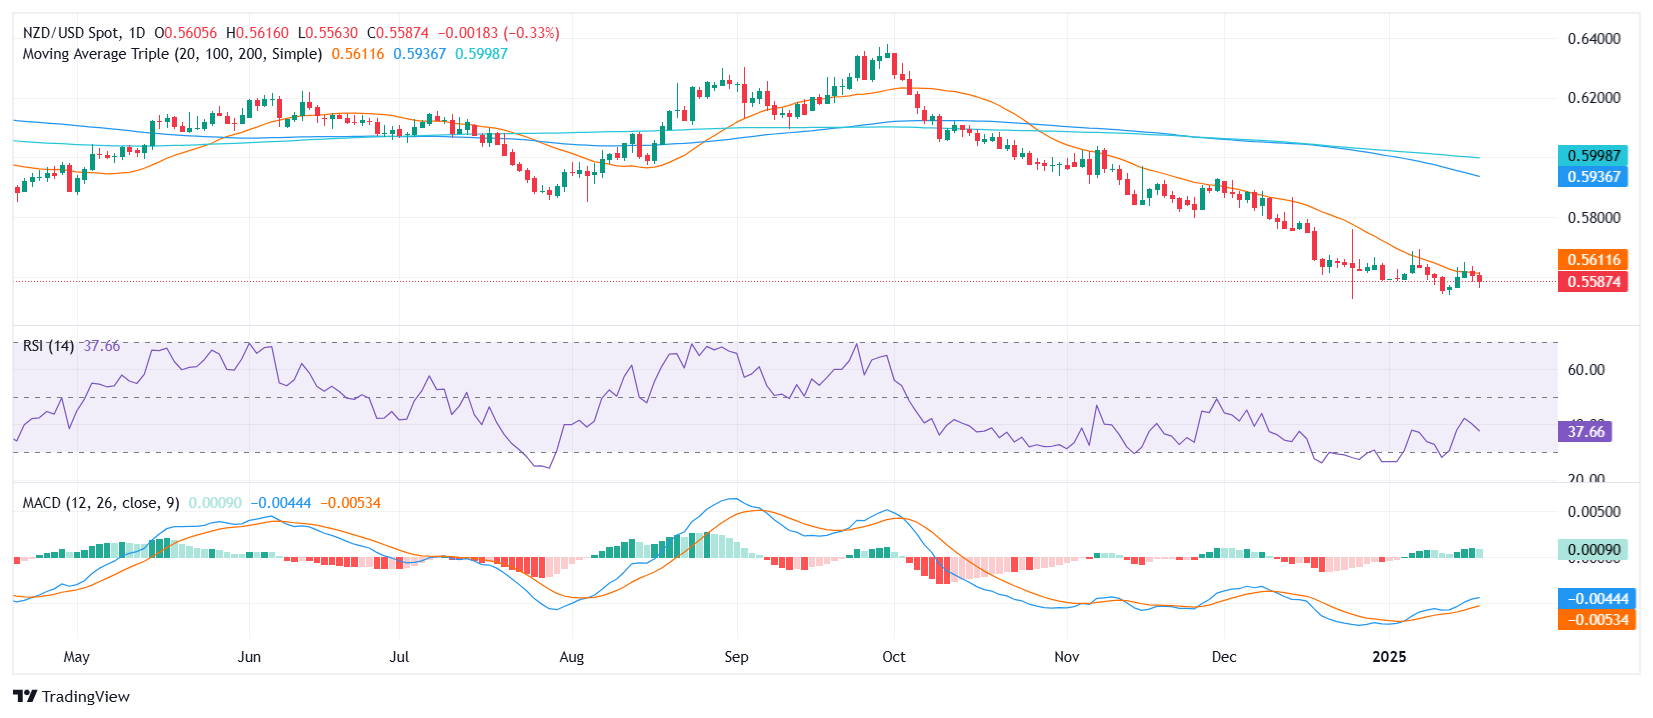
- NZD/USD fell at the end of the week, resting around 0.5590 after struggling to maintain previous gains.
- The RSI falls to 40 in negative territory, signaling weakening momentum as sellers regain confidence.
- The MACD histogram shows rising green bars, hinting that not all bullish interest has disappeared despite the decline.
The NZD/USD pair lost ground on Friday, sliding 0.30% to settle near 0.5590. This drop calls into question the sustainability of the pair’s recent consolidation above its 20-day SMA, a region that could still offer a line of defense for buyers hoping to maintain bullish traction. With sellers starting to erode the gains seen earlier in the week, it remains uncertain whether the pair can hold on to its fragile support zone.
From a technical perspective, momentum readings are mixed. The Relative Strength Index (RSI) has sharply retreated to 40, underscoring a renewed bout of bearish pressure. Meanwhile, the Moving Average Convergence/Divergence (MACD) histogram continues to produce green bars, suggesting that some underlying bullish sentiment persists but in a less confident manner. These mixed signals underscore the delicate nature of the current price action.
If NZD/USD does indeed consolidate near the 20-day SMA, now around the 0.5600 mark, buyers may attempt another push higher, with 0.5630 serving as an interim hurdle before a possible run towards 0.5650. Conversely, a decisive break below 0.5580 would likely return control to the bears, exposing lower targets near the 0.5550 region and undermining the pair’s nascent support base.
NZD/USD daily chart
Source: Fx Street
I am Joshua Winder, a senior-level journalist and editor at World Stock Market. I specialize in covering news related to the stock market and economic trends. With more than 8 years of experience in this field, I have become an expert in financial reporting.


