
- NZD/USD bulls eye horizontal resistance and a test of 0.6270 keeping an eye on 0.6300.
- The right side of the reverse head and shoulder pattern is underway.
He NZD/USD is in the middle of completing the right side of the reverse head and shoulders pattern, as the following charts illustrate:
NZD/USD weekly chart
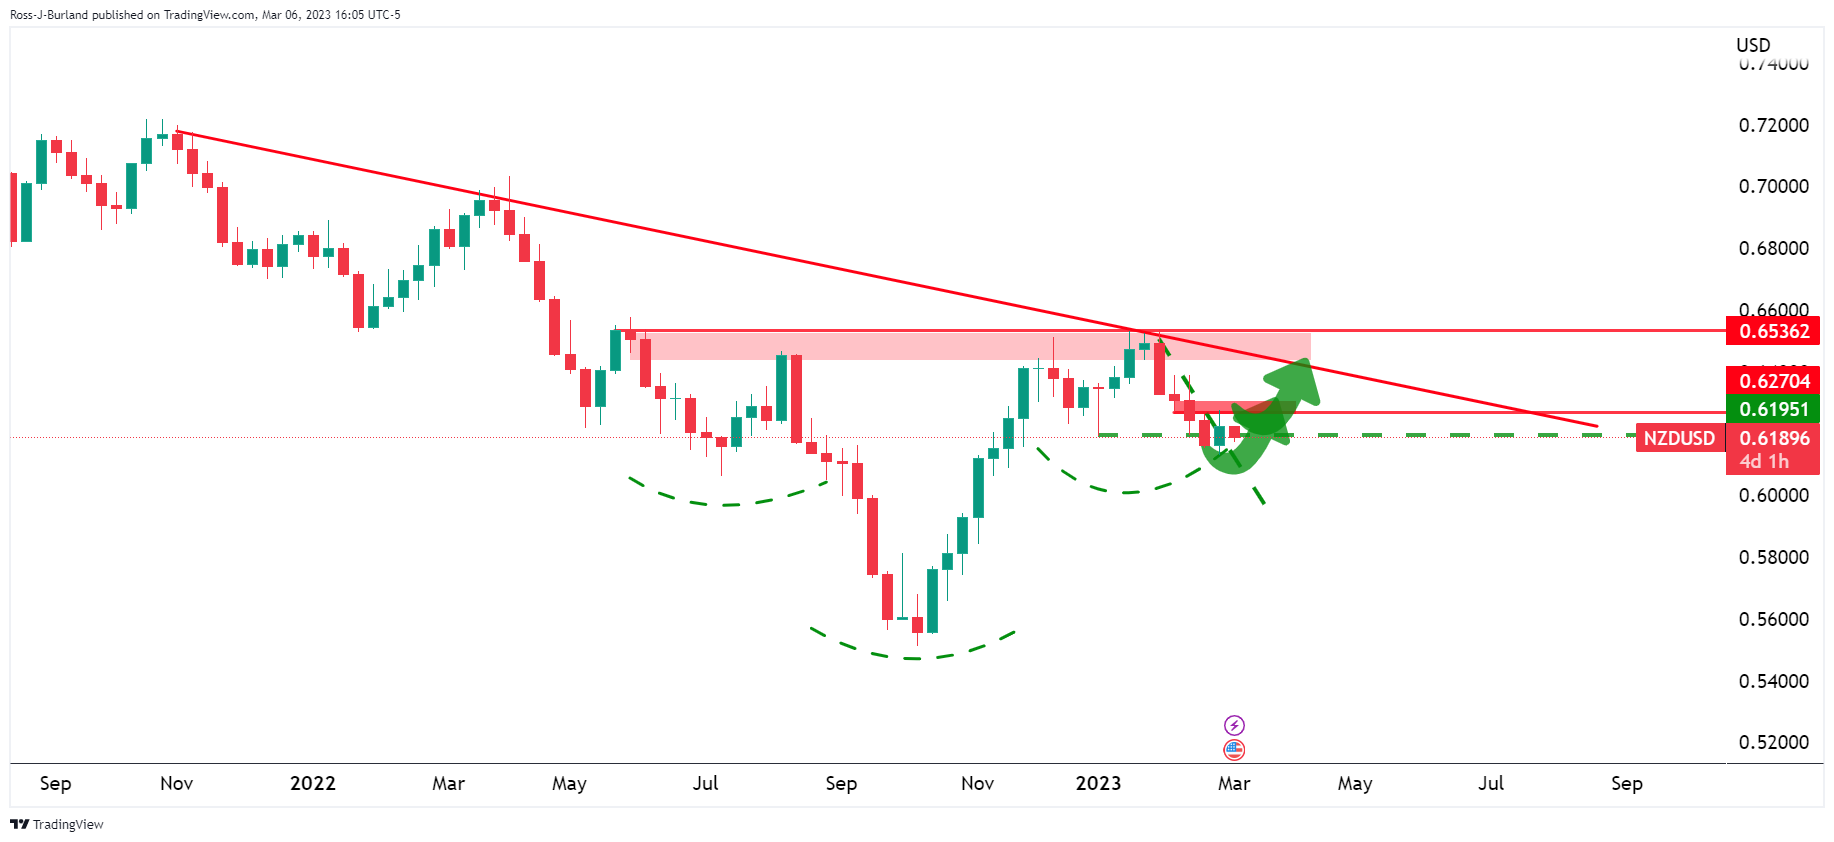
The price has buried below the trend line resistance and the neckline of the head and shoulders pattern as on the previous weekly chart.
NZD/USD daily chart
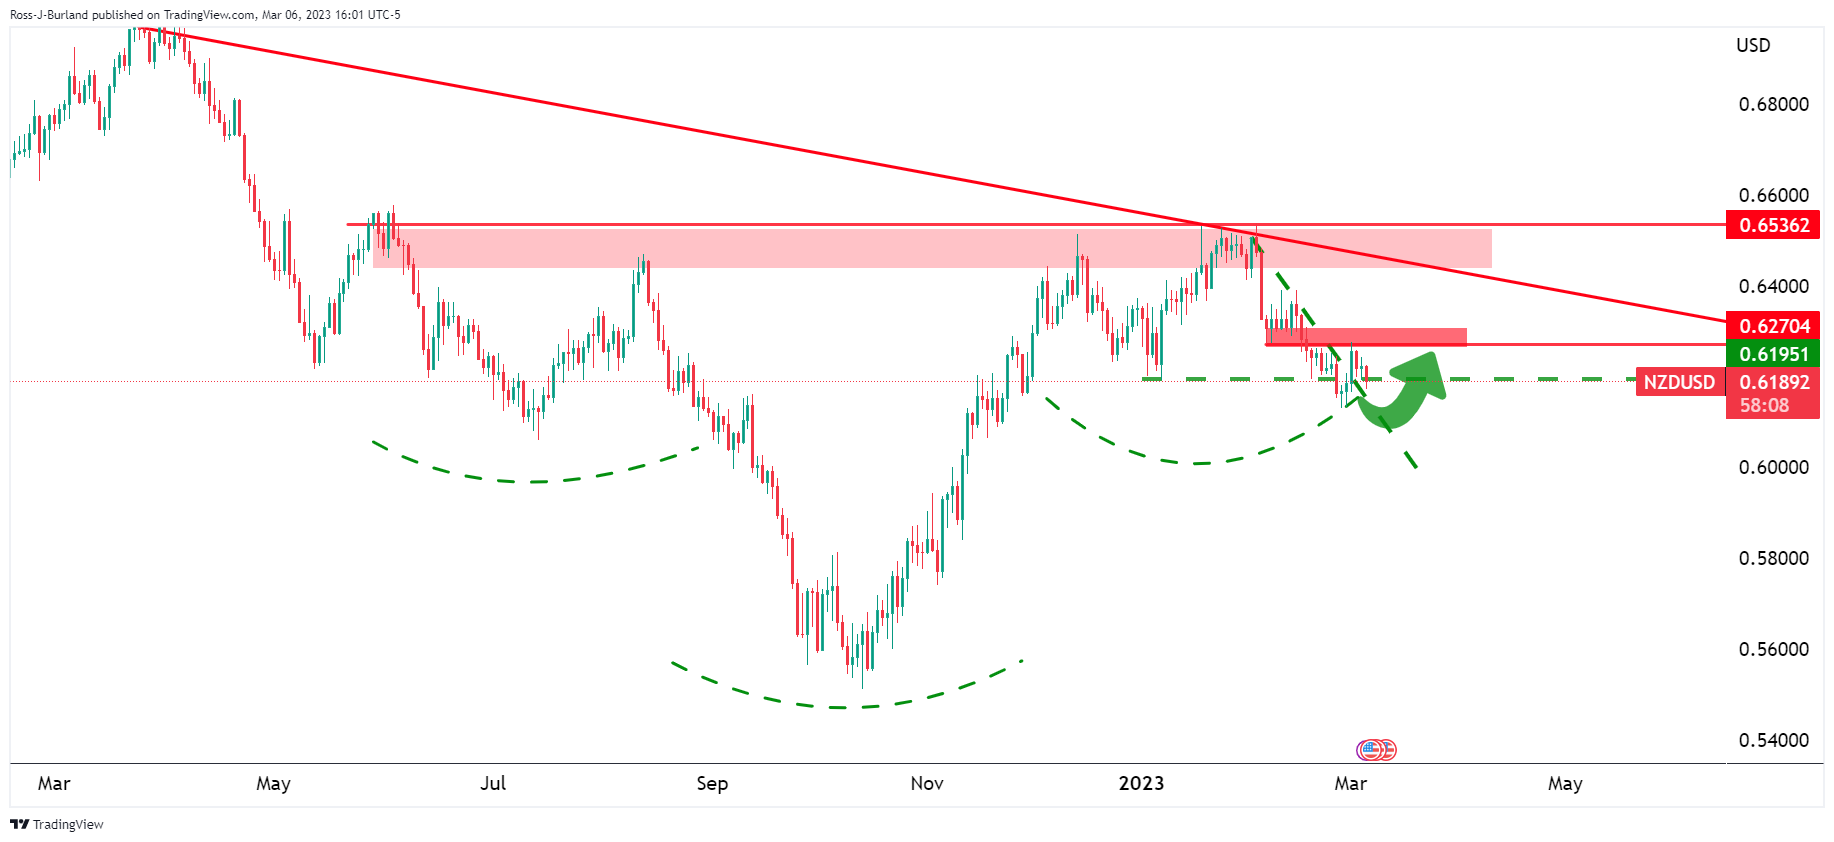
The right shoulder is being carved:
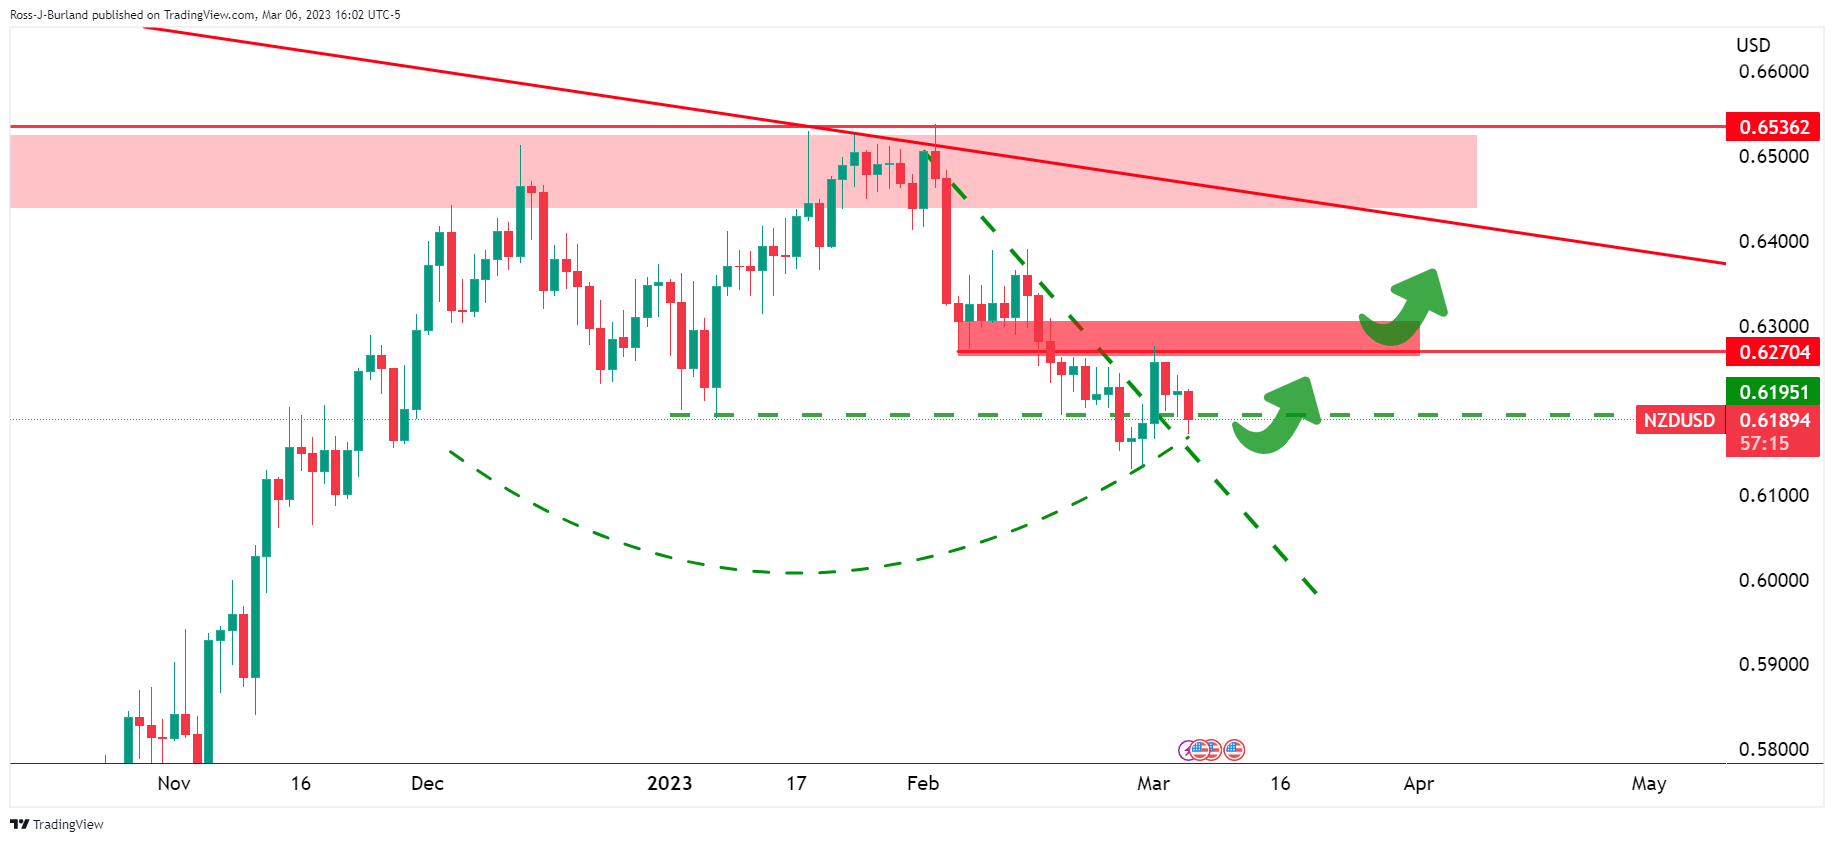
Breakout shorts have been activated in the market after the break of 0.6200, which leaves prospects for a compression of shorts and the completion of the lows at the right shoulder. This leaves prospects for a move towards horizontal resistance and a test of 0.6270 protecting 0.6300.
Source: Fx Street
I am Joshua Winder, a senior-level journalist and editor at World Stock Market. I specialize in covering news related to the stock market and economic trends. With more than 8 years of experience in this field, I have become an expert in financial reporting.


