
- The NZD/USD pair falls to 0.5900 although the US Dollar remains sideways.
- Investors await the US core PCE price index that will influence Fed rate cut speculation.
- The NZD/USD pair has been consolidating in a range of 0.5850-0.5933 for almost a week.
The NZD/USD pair falls near the crucial support of 0.5900 in the European session on Tuesday as it attempts to break above the immediate resistance of 0.5930. The New Zealand asset is expected to move sideways as investors await US personal consumption expenditure (PCE) price index data for March, which will be released on Friday.
The inflation data will be the subject of close attention as it will provide clues about when the Federal Reserve (Fed) could begin to reduce interest rates. Inflation data will influence the Fed's interest rate guidance, which will be released at next week's policy meeting, where policy rates are widely expected to remain unchanged. in the range of 5.25%-5.50%.
Market sentiment remains cheerful as investors hope that the conflicts between Iran and Israel do not escalate further. S&P 500 futures have posted significant gains in the London session, reflecting investors' increased risk appetite. 10-year US Treasury yield nears 4.63%, eye on US core inflation data PCE US, which is expected to have grown 0.3% month-on-month.
New Zealand dollar falls despite improving attractiveness of risk-sensitive assets. Meanwhile, expectations remain strong that the Reserve Bank of New Zealand (RBNZ) will cut interest rates at the end of November. Speculation for the RBNZ to pivot interest rate cuts has been postponed to later this year after the first quarter Consumer Price Index (CPI) was expected to grow by 0.6%.
The NZD/USD pair has fluctuated between 0.5850 and 0.5933 over the past week, suggesting a sharp contraction in volatility. The 20-period EMA at 0.5910 remains attached to the pair and shows indecision among market participants.
The 14-period RSI is oscillating in the 40.00-60.00 range, suggesting future consolidation.
Further declines would occur if the pair broke below the April 16 low at 0.5860. This would drag the pair towards the September 8, 2023 low at 0.5847, followed by the 0.5900 round level support.
On the other hand, a recovery move above the March 18 high at 0.6100 will take the pair towards the March 12 low at 0.6135. Breaking this last level will push the asset towards the February 9 high around 0.6160.
NZD/USD four-hour chart
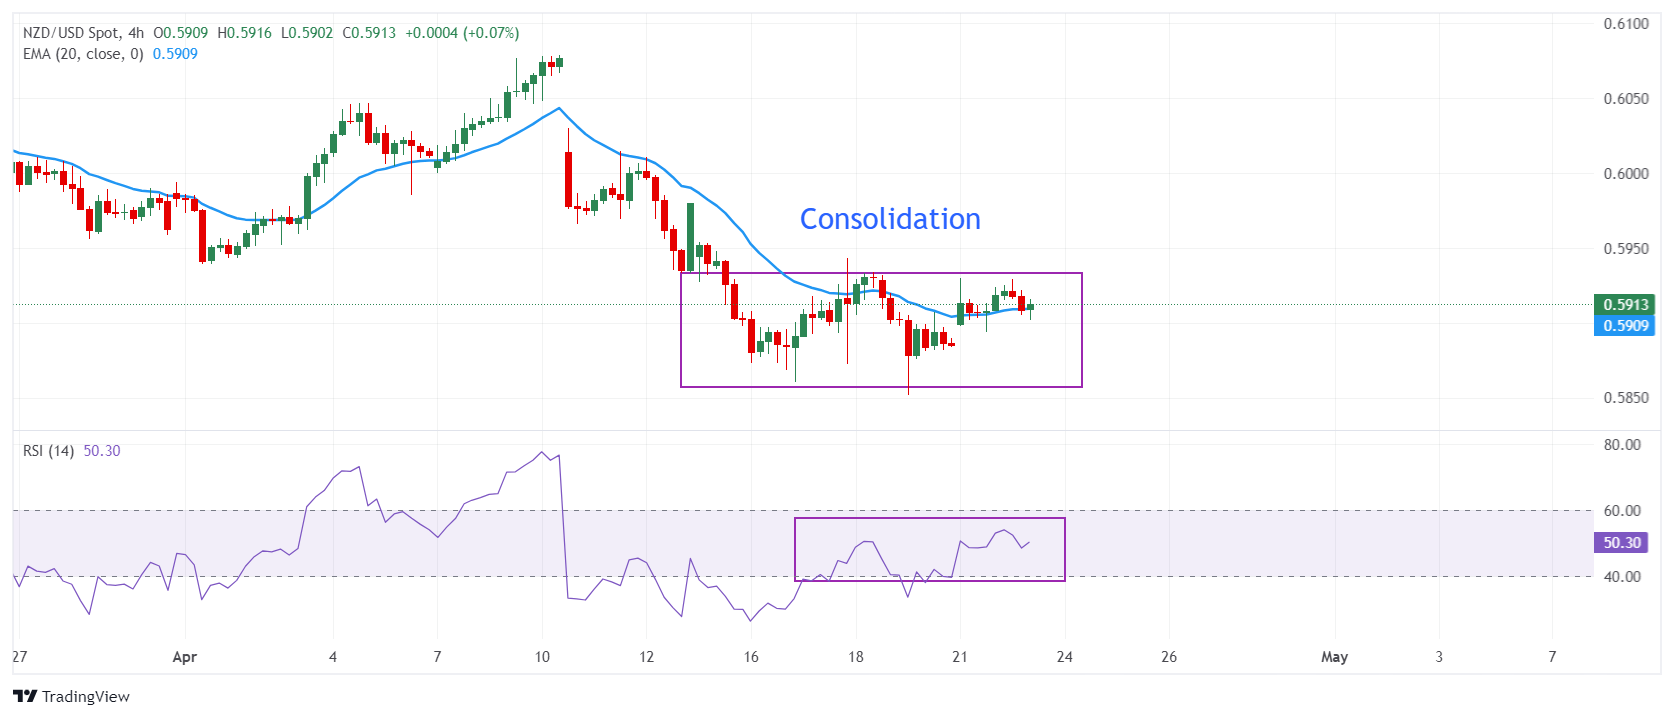
Source: Fx Street
I am Joshua Winder, a senior-level journalist and editor at World Stock Market. I specialize in covering news related to the stock market and economic trends. With more than 8 years of experience in this field, I have become an expert in financial reporting.


