
- NZD/USD rises to 0.5960 as the US dollar appears weak ahead of US Q1 GDP data.
- The consensus shows that the US economy expanded 2.5% in the January-March period.
- The New Zealand dollar advances on improving demand for risk currencies.
The NZD/USD pair extends its winning streak for the fourth trading session on Thursday. The pair advances to 0.5960, while the US dollar continues to fall amid concerns about the US economic outlook due to a sharp drop in new business entries in April, shown by S&P Global's preliminary PMI report. The US Dollar Index (DXY), which tracks the US dollar against six major currencies, falls to 10-day lows near 105.50.
The downward movement of the US Dollar has improved demand for risk-sensitive currencies. However, market sentiment remains uncertain as investors focus their attention on preliminary US GDP data for the first quarter, due at 12:30 GMT. The US economy is expected to have grown at a moderate pace of 2.5%, compared to the 3.4% recorded in the last quarter of last year.
Looking ahead, investors will also be keeping an eye on March personal consumption price index (PCE) data, which is the Fed's preferred inflation measure. The inflation measure is estimated to have grown 0.3% intermonthly. This will influence speculation about Federal Reserve (Fed) rate cuts, currently planned for the September meeting.
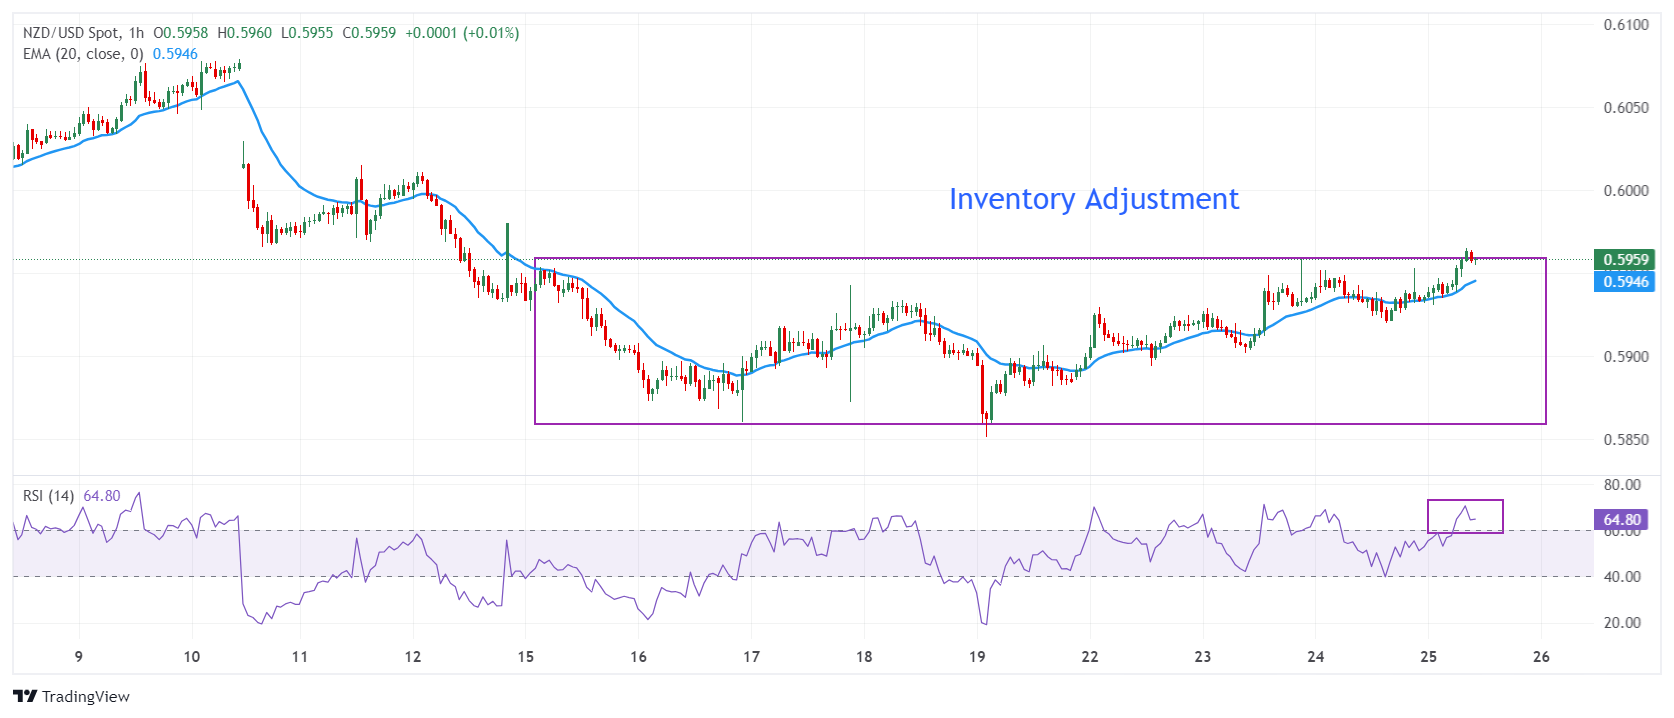
The NZD/USD pair is trading near the upper end of the inventory tightening phase in which positions in the New Zealand Dollar are exchanged between institutional investors and retail participants. It is difficult to characterize the “accumulation” or “distribution” phase before a decisive breakout. A decisive movement of the New Zealand asset is expected after the publication of the US GDP data for the first quarter.
The upward slope of the 20-period EMA at 0.5947 provides short-term bullish appeal for the New Zealand Dollar.
The 14-period RSI breaks above the 60.00 level, suggesting fresh bullish momentum.
Fresh bullish momentum above the psychological resistance of 0.6000 would push the asset towards the April 4 high around 0.6050 and the round level resistance of 0.6100.
Conversely, a further decline would occur if the asset broke below the April 16 low at 0.5860. This would drag the asset towards the September 8, 2023 low at 0.5847, followed by the round support level of 0.5900.
NZD/USD hourly chart
Source: Fx Street
I am Joshua Winder, a senior-level journalist and editor at World Stock Market. I specialize in covering news related to the stock market and economic trends. With more than 8 years of experience in this field, I have become an expert in financial reporting.


