
- The NZD/USD finds provisional support near 0.6070, while the falls are favored by the bad mood of the markets.
- The Fed chair could maintain hawkish rhetoric in his testimony before Congress on Wednesday.
- China's ambitious growth target fails to increase the attractiveness of the New Zealand dollar.
The pair NZD/USD finds some buying interest after a sell-off to near 0.6070 during the European session on Tuesday. The pair is expected to remain on hold as investors await Federal Reserve (Fed) Chairman Jerome Powell's testimony before Congress, scheduled for Wednesday and Thursday.
Powell expected to maintain hawkish rhetoric amid the absence of evidence that could point to significant progress in lowering inflation towards the 2% target.
Market sentiment remains cautious before Powell's testimony. S&P 500 futures have generated significant losses in the London session. The DXY Dollar Index rises slightly by 0.03% to 103.85.
Meanwhile, The ambitious target of 5% of the Gross Domestic Product (GDP) set by Chinese Prime Minister Li Qiang by 2024 has failed to raise demand for the New Zealand dollar. The New Zealand economy is one of China's largest trading partners, and improved Chinese economic prospects often translate into positive developments in the New Zealand dollar.
The NZD/USD pair retreats towards the horizontal support of the descending triangle pattern on a 4-hour time frame, situated from the January 23 low at 0.6062. The bearish frontier of the said chart pattern is drawn from the December 25 high at 0.6410.
Typically, a descending triangle pattern shows indecision among market participants, but with a slight bearish bias due to lower highs and flat lows.
The pair remains below the 50-period EMA near 0.6118, indicating near-term demand uncertainty.
The 14-period Relative Strength Index (RSI) falls within the bearish range of 20-40 after failing to move in the 40-60 zone. That shows a behavior of “selling the rises” of the pair by market participants.
Looking ahead, a bearish move below the Feb. 13 low near 0.6050 would expose the pair to psychological support from 0.6000followed by the November 9 high in 0.5956.
On the other hand, a bullish move would occur if NZD/USD broke above the round resistance of 0.6200which would take the pair towards the February 22 high in 0.6220followed by the January 11 high in 0.6260.
NZD/USD 4-hour chart
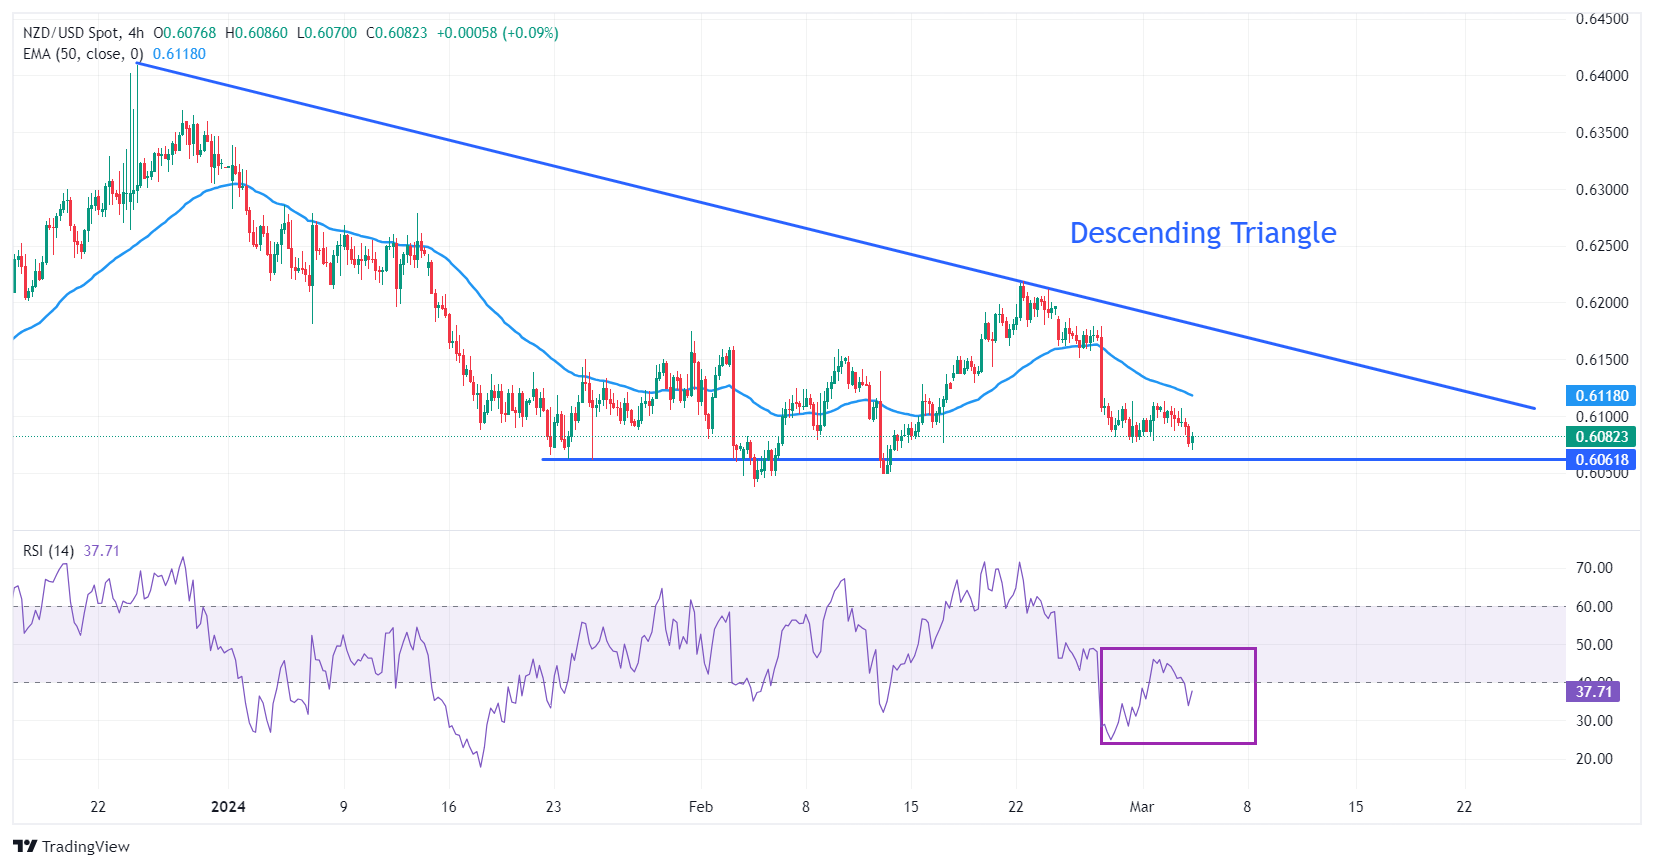
Source: Fx Street
I am Joshua Winder, a senior-level journalist and editor at World Stock Market. I specialize in covering news related to the stock market and economic trends. With more than 8 years of experience in this field, I have become an expert in financial reporting.


